> ## Documentation Index
> Fetch the complete documentation index at: https://docs.mapxagent.com/llms.txt
> Use this file to discover all available pages before exploring further.
# Viewing your map in 3D
> Tilt the map into a 3D perspective, render layers as columns, paths, arcs, or extruded areas, and control each layer's 3D style.
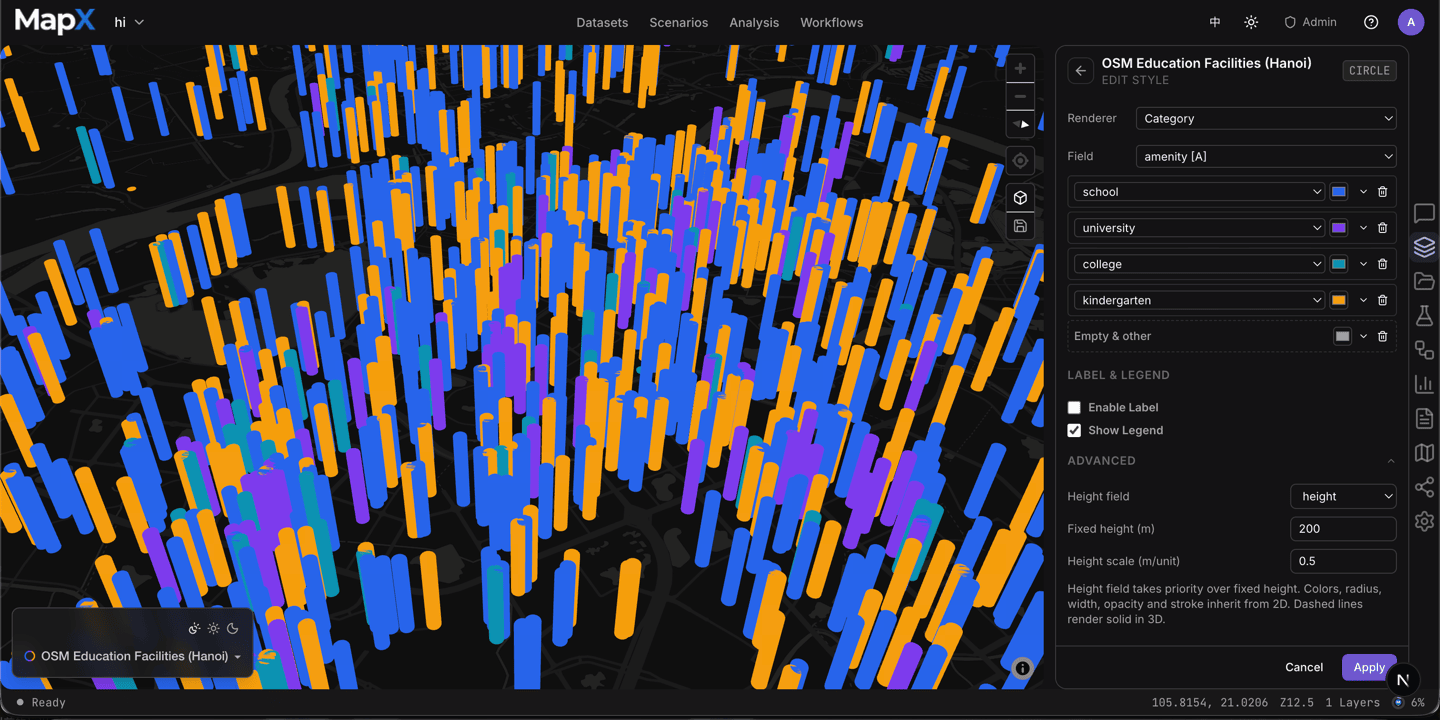
MapX can tilt the map into a 3D perspective, turning flat point, line, and area layers into columns, paths, arcs, and extruded surfaces. The 3D view is a different way to look at the same data — switch back to 2D at any time without losing your 2D styling.
## Switch between 2D and 3D
Use the 3D toggle in the map's top-right control stack to tilt the map into a perspective view. The button below it saves the current camera as a view you can return to later. Your 2D/3D mode and camera are saved with the project, so reopening it returns to the same view.
 ```text Example prompt theme={null}
switch to 3D view
```
```text Example prompt theme={null}
go back to 2D
```
```text Example prompt theme={null}
switch to 3D view
```
```text Example prompt theme={null}
go back to 2D
```
 ## How layers render in 3D
By default, each layer's 3D appearance is derived automatically from its 2D style:
* **Point layers** render as 3D columns.
* **Line layers** render as elevated paths (or arcs and animated trips).
* **Area layers** render as extruded polygons.
Database layers work in 3D too. Layers backed by a PostGIS database use the
same columns, raised paths, and extruded areas as uploaded data, and large
layers appear progressively on screen while they load.
Open a layer's style editor and use the **3D style** section to override the automatic projection. You can set:
* for columns — color or a color ramp, height (or a height field), radius, and opacity;
* for paths, arcs, and trips — color, width, opacity, and arc height or trip time field;
* for extruded areas — fill color, height (or a height field), and opacity.
```text Example prompt theme={null}
show population as columns in 3D, colored by district
```
```text Example prompt theme={null}
make the roads into blue arcs
```
## Hexagon aggregation
Point layers can be aggregated into a hexagon grid (H3). Choose **Hexagon (H3)** as the renderer in the style editor; in 2D the hexagons render as a flat grid, and in 3D they are extruded into cells. Set the resolution, the color and height fields, and the aggregation method (sum, average, minimum, maximum, or count).
```text Example prompt theme={null}
aggregate the points into hexagons and extrude them by total sales
```
## Labels in 3D
Labels stay visible in 3D. Point layers are labeled above their column, and line layers are labeled at the midpoint of each line. MapX spaces labels apart so they avoid overlapping where possible.
## Notes
* 2D and 3D styles are independent: changing the 3D appearance does not change how the layer looks in 2D, and vice versa.
* Switching back to 2D restores each layer's original 2D style automatically.
This documentation is built and hosted on [Mintlify](https://mintlify.com), a developer documentation platform.
## How layers render in 3D
By default, each layer's 3D appearance is derived automatically from its 2D style:
* **Point layers** render as 3D columns.
* **Line layers** render as elevated paths (or arcs and animated trips).
* **Area layers** render as extruded polygons.
Database layers work in 3D too. Layers backed by a PostGIS database use the
same columns, raised paths, and extruded areas as uploaded data, and large
layers appear progressively on screen while they load.
Open a layer's style editor and use the **3D style** section to override the automatic projection. You can set:
* for columns — color or a color ramp, height (or a height field), radius, and opacity;
* for paths, arcs, and trips — color, width, opacity, and arc height or trip time field;
* for extruded areas — fill color, height (or a height field), and opacity.
```text Example prompt theme={null}
show population as columns in 3D, colored by district
```
```text Example prompt theme={null}
make the roads into blue arcs
```
## Hexagon aggregation
Point layers can be aggregated into a hexagon grid (H3). Choose **Hexagon (H3)** as the renderer in the style editor; in 2D the hexagons render as a flat grid, and in 3D they are extruded into cells. Set the resolution, the color and height fields, and the aggregation method (sum, average, minimum, maximum, or count).
```text Example prompt theme={null}
aggregate the points into hexagons and extrude them by total sales
```
## Labels in 3D
Labels stay visible in 3D. Point layers are labeled above their column, and line layers are labeled at the midpoint of each line. MapX spaces labels apart so they avoid overlapping where possible.
## Notes
* 2D and 3D styles are independent: changing the 3D appearance does not change how the layer looks in 2D, and vice versa.
* Switching back to 2D restores each layer's original 2D style automatically.
This documentation is built and hosted on [Mintlify](https://mintlify.com), a developer documentation platform.