> ## Documentation Index
> Fetch the complete documentation index at: https://docs.mapxagent.com/llms.txt
> Use this file to discover all available pages before exploring further.
# Spatial analysis in MapX
> MapX analysis runs deterministic spatial tools — distance, overlay, network, terrain, raster and statistics — against your project data. Start them from the chat or from the Analysis catalog.
Analysis in MapX is a catalog of **deterministic spatial tools** that run on the server against your project data — the operations you would otherwise script in PostGIS, pgRouting, GDAL, QGIS, or Python. The AI chooses the tool and fills in the parameters when you ask in chat, but the computation itself is a fixed tool run, so results are reproducible.
 ## Where analysis lives
Analysis has two surfaces, and they are not the same thing:
| Where | What it is | Use it for |
| - | - | - |
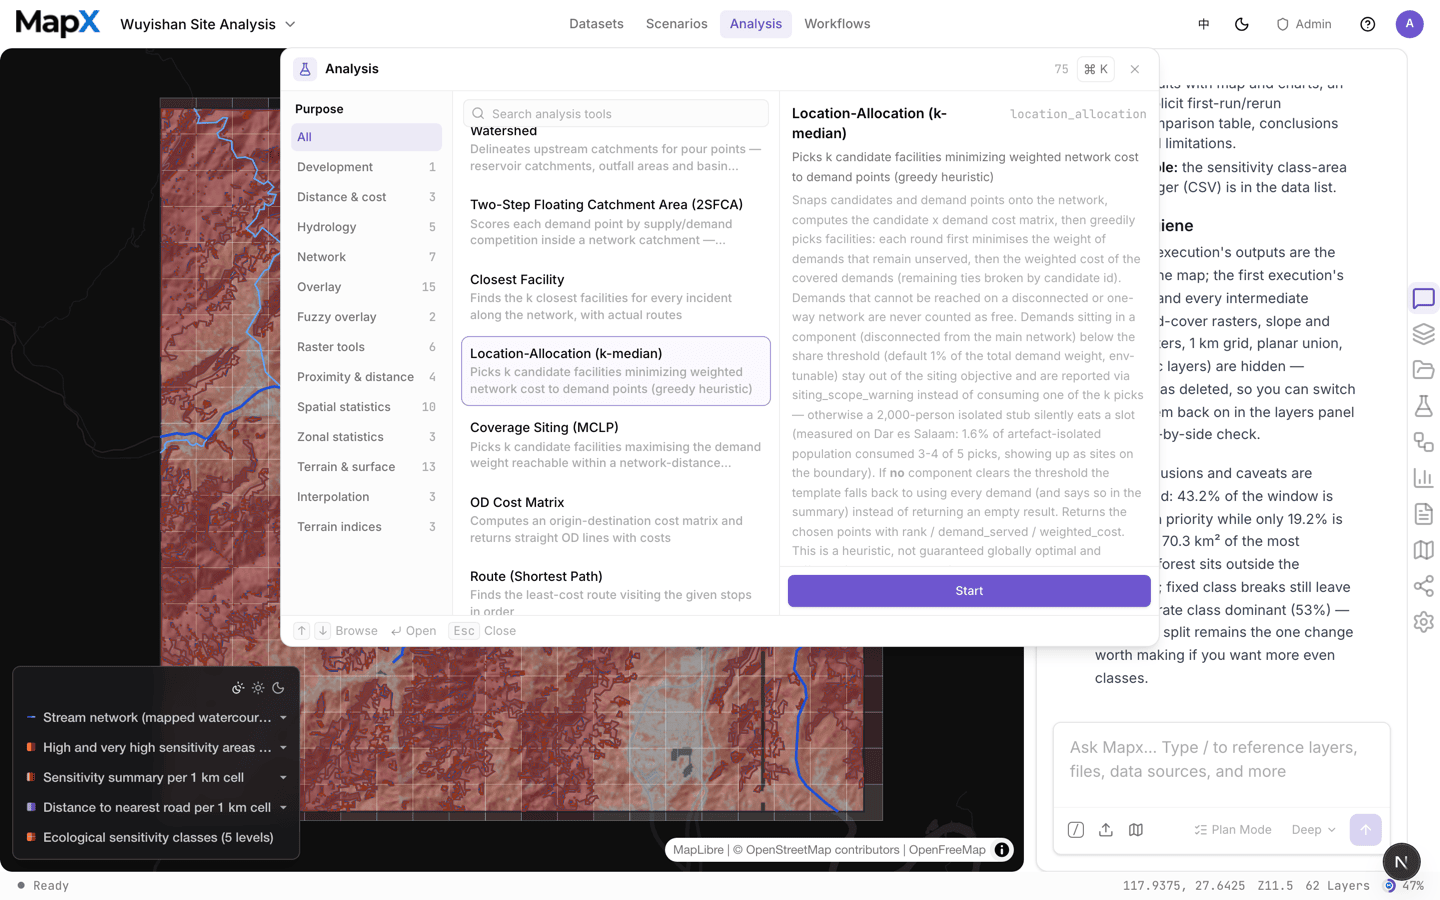
| Top menu → **Analysis** | The tool catalog: families, search, parameters, and a **Start** button | Running a tool on purpose, with the inputs and parameters you choose |
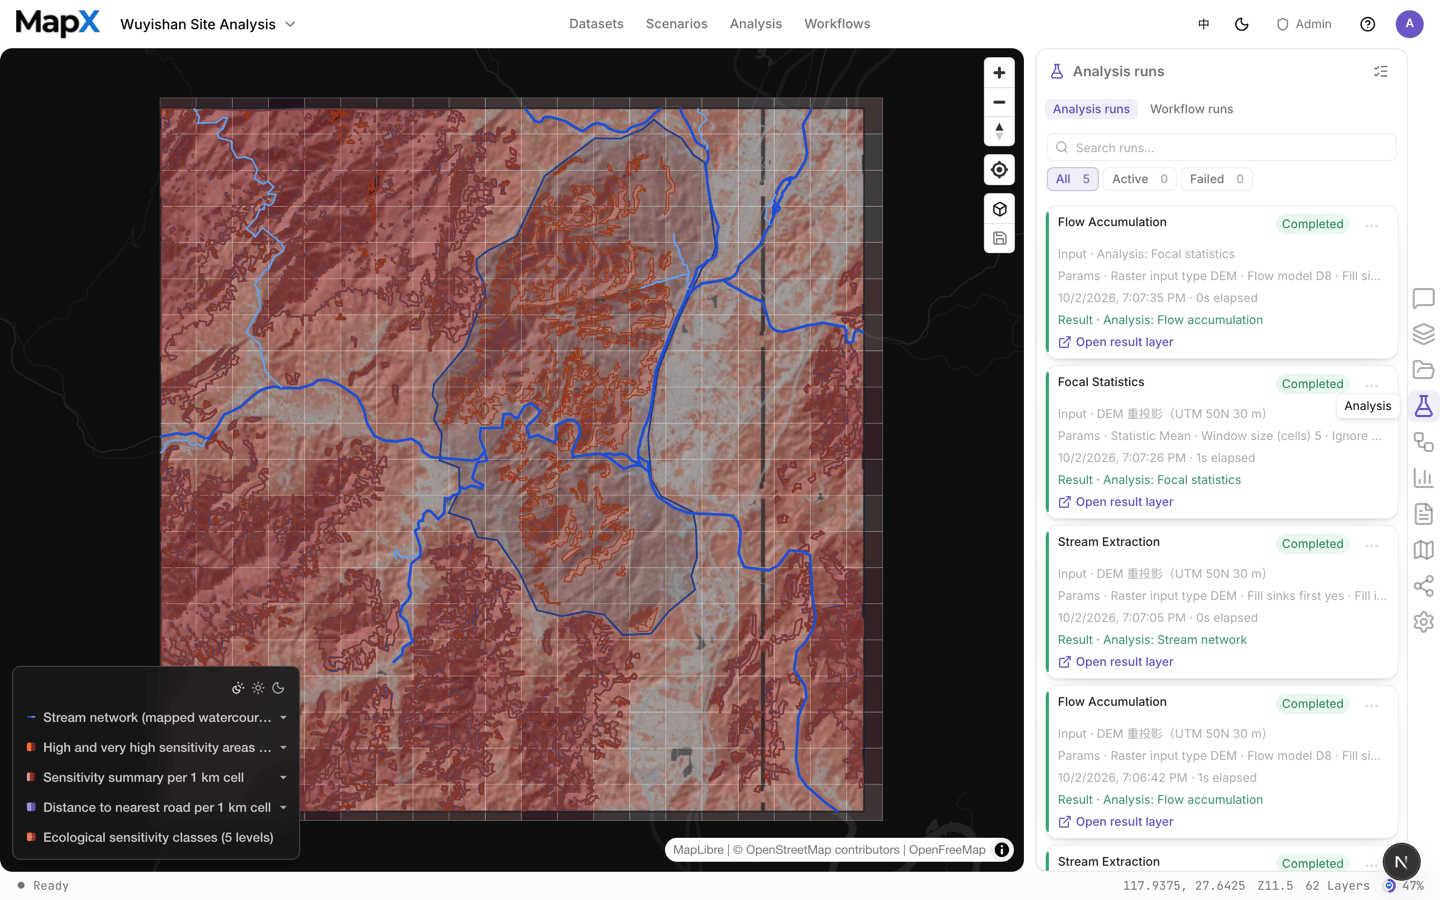
| Right rail → **Analysis** | The run ledger of the current project | Checking status, elapsed time, results, statistics, and failures |
## Where analysis lives
Analysis has two surfaces, and they are not the same thing:
| Where | What it is | Use it for |
| - | - | - |
| Top menu → **Analysis** | The tool catalog: families, search, parameters, and a **Start** button | Running a tool on purpose, with the inputs and parameters you choose |
| Right rail → **Analysis** | The run ledger of the current project | Checking status, elapsed time, results, statistics, and failures |
 ## Tool families
The catalog ships more than 70 tools, grouped into twelve families. The counts below are the current defaults; open **Analysis** and search to see the exact list for your deployment.
| Family | What it covers | Tools |
| - | - | - |
| Distance & cost | Euclidean distance, cost distance, least-cost paths | 3 |
| Hydrology | Sink filling, flow direction, flow accumulation, watershed, stream extraction | 5 |
| Network | Service areas, closest facility, OD cost matrix, shortest route, location-allocation | 7 |
| Overlay | Clip, erase, intersect, union, merge and dissolve, plus weighted overlay and polygon-to-point | 15 |
| Fuzzy overlay | Membership functions and fuzzy combination (AND / OR / PRODUCT / SUM / GAMMA) | 2 |
| Raster tools | Raster calculator, clip, reproject and resample, two-epoch change matrix | 6 |
| Proximity & distance | Buffers, nearest distance, distance bands, service rings | 4 |
| Spatial statistics | Grids, quadrants, hot spots, mean centre, standard deviational ellipse, expansion metrics, OLS / GWR | 10 |
| Zonal statistics | Aggregate raster, vector or classified raster by zone polygons, including zone × class crosstabs | 3 |
| Terrain & surface | Slope, aspect, curvature, roughness, landforms, hillshade, contours, viewshed, reclassify | 13 |
| Interpolation | IDW, kriging, TIN | 3 |
| Terrain indices | Wetness, stream power, sediment transport indices | 3 |
## Run a tool
Press ⌘+K or open the top menu and choose **Analysis**. Filter by family, or type a keyword such as *buffer*, *service area*, or *slope*.
Selecting a tool shows what it answers, its inputs, and its parameters. Inputs are **typed**: a tool that expects polygon zones will not accept a point layer, and the picker only offers layers that fit.
Choose the layer or layers the tool runs on. Most tools take one input; overlay and network tools take two or more (for example *origin layer* and *destination layer*).
Parameters are typed too — distances in meters, classifications, field names, thresholds. Fields come from the columns actually present in the layer you selected.
Choose **Start**. The run is queued, then executes on the server. You can keep working in the project while it runs.
## Read the result
Each run produces a result layer, and some tools also produce tables or charts:
* **Result layer** — appears in the layer list and on the map, styled with a default legend the tool declares. Open **Layers** to restyle it like any other layer.
* **Statistics** — numeric summaries (counts, areas, means, coverage) are attached to the run, not only to the map.
* **Data table** — tabular outputs open in the data table panel and can be exported.
## Statuses and failures
Runs move through a small state machine: **queued → running → succeeded**, with **failed** and **cancelled** as terminal states. The ledger shows elapsed time per run and keeps a history per project.
When a run fails, MapX reports the reason in plain language and suggests the next step — for example a scale or memory budget that the input exceeds, a missing field, or a data source that needs filling before terrain analysis. Typical fixes:
* **Input too large** — clip the extent first, or run the tool on a subset.
* **Wrong geometry type** — check the layer type in the **Layers** panel; some tools need polygons where you have points, or the reverse.
* **Missing or invalid data** — raster tools need a valid CRS and real values; hydrology tools need filled sinks.
Retrying a failed run keeps the inputs and parameters, so you only change what caused the failure. Deleting a run record removes the record and its detail, **not** the layers, charts, and reports it produced.
Running a tool does not call the AI model, so the computation itself does not consume AI credits — the conversation that sets it up does. See [Credits](/en/account/credits) for how AI usage is billed.
## Chat or catalog?
Use **chat** when you are exploring: you describe the question, the AI chains the right tools, and you refine by asking follow-ups. Use the **catalog** when you already know the operation you need, or when you want to control inputs and parameters exactly.
Both paths write to the same run ledger, so a run started by the AI and a run started by hand are auditable in the same place.
## Related
* [AI chat](/en/concepts/ai-chat) — how the AI selects tools and chains them
* [Built-in datasets](/en/concepts/builtin-datasets) — ready-made inputs for analysis
* [Scenarios](/en/concepts/scenarios) — prepared study areas with suggested analyses
* [Workflows and plans](/en/concepts/workflows) — turn a multi-step analysis into a repeatable workflow
* [Layers](/en/concepts/layers) — styling and managing result layers
This documentation is built and hosted on [Mintlify](https://mintlify.com), a developer documentation platform.
## Tool families
The catalog ships more than 70 tools, grouped into twelve families. The counts below are the current defaults; open **Analysis** and search to see the exact list for your deployment.
| Family | What it covers | Tools |
| - | - | - |
| Distance & cost | Euclidean distance, cost distance, least-cost paths | 3 |
| Hydrology | Sink filling, flow direction, flow accumulation, watershed, stream extraction | 5 |
| Network | Service areas, closest facility, OD cost matrix, shortest route, location-allocation | 7 |
| Overlay | Clip, erase, intersect, union, merge and dissolve, plus weighted overlay and polygon-to-point | 15 |
| Fuzzy overlay | Membership functions and fuzzy combination (AND / OR / PRODUCT / SUM / GAMMA) | 2 |
| Raster tools | Raster calculator, clip, reproject and resample, two-epoch change matrix | 6 |
| Proximity & distance | Buffers, nearest distance, distance bands, service rings | 4 |
| Spatial statistics | Grids, quadrants, hot spots, mean centre, standard deviational ellipse, expansion metrics, OLS / GWR | 10 |
| Zonal statistics | Aggregate raster, vector or classified raster by zone polygons, including zone × class crosstabs | 3 |
| Terrain & surface | Slope, aspect, curvature, roughness, landforms, hillshade, contours, viewshed, reclassify | 13 |
| Interpolation | IDW, kriging, TIN | 3 |
| Terrain indices | Wetness, stream power, sediment transport indices | 3 |
## Run a tool
Press ⌘+K or open the top menu and choose **Analysis**. Filter by family, or type a keyword such as *buffer*, *service area*, or *slope*.
Selecting a tool shows what it answers, its inputs, and its parameters. Inputs are **typed**: a tool that expects polygon zones will not accept a point layer, and the picker only offers layers that fit.
Choose the layer or layers the tool runs on. Most tools take one input; overlay and network tools take two or more (for example *origin layer* and *destination layer*).
Parameters are typed too — distances in meters, classifications, field names, thresholds. Fields come from the columns actually present in the layer you selected.
Choose **Start**. The run is queued, then executes on the server. You can keep working in the project while it runs.
## Read the result
Each run produces a result layer, and some tools also produce tables or charts:
* **Result layer** — appears in the layer list and on the map, styled with a default legend the tool declares. Open **Layers** to restyle it like any other layer.
* **Statistics** — numeric summaries (counts, areas, means, coverage) are attached to the run, not only to the map.
* **Data table** — tabular outputs open in the data table panel and can be exported.
## Statuses and failures
Runs move through a small state machine: **queued → running → succeeded**, with **failed** and **cancelled** as terminal states. The ledger shows elapsed time per run and keeps a history per project.
When a run fails, MapX reports the reason in plain language and suggests the next step — for example a scale or memory budget that the input exceeds, a missing field, or a data source that needs filling before terrain analysis. Typical fixes:
* **Input too large** — clip the extent first, or run the tool on a subset.
* **Wrong geometry type** — check the layer type in the **Layers** panel; some tools need polygons where you have points, or the reverse.
* **Missing or invalid data** — raster tools need a valid CRS and real values; hydrology tools need filled sinks.
Retrying a failed run keeps the inputs and parameters, so you only change what caused the failure. Deleting a run record removes the record and its detail, **not** the layers, charts, and reports it produced.
Running a tool does not call the AI model, so the computation itself does not consume AI credits — the conversation that sets it up does. See [Credits](/en/account/credits) for how AI usage is billed.
## Chat or catalog?
Use **chat** when you are exploring: you describe the question, the AI chains the right tools, and you refine by asking follow-ups. Use the **catalog** when you already know the operation you need, or when you want to control inputs and parameters exactly.
Both paths write to the same run ledger, so a run started by the AI and a run started by hand are auditable in the same place.
## Related
* [AI chat](/en/concepts/ai-chat) — how the AI selects tools and chains them
* [Built-in datasets](/en/concepts/builtin-datasets) — ready-made inputs for analysis
* [Scenarios](/en/concepts/scenarios) — prepared study areas with suggested analyses
* [Workflows and plans](/en/concepts/workflows) — turn a multi-step analysis into a repeatable workflow
* [Layers](/en/concepts/layers) — styling and managing result layers
This documentation is built and hosted on [Mintlify](https://mintlify.com), a developer documentation platform.