> ## Documentation Index
> Fetch the complete documentation index at: https://docs.mapxagent.com/llms.txt
> Use this file to discover all available pages before exploring further.
# Generating and Delivering Professional Reports
> Turn any MapX analysis into an HTML, Word, or PPT report with maps, charts, tables, and AI-written insights — preview it, iterate with the AI, export a PDF, and share.
When your analysis is complete, the last thing you want to do is spend an hour copy-pasting map screenshots into a slide deck. MapX packages your analysis — maps, charts, data, and narrative — into a polished report. Describe what you need in the chat and MapX assembles the deliverable for you, in HTML, Word, or PowerPoint form, with PDF available as an export.
## What a MapX report can contain
Depending on what you ask for and what your project contains, a report can include:
* **Interactive or static maps** — the map views and layers from your analysis, rendered as live interactive maps or static exports
* **Charts** — charts from your project, embedded with their titles and insights
* **Data summary tables** — filtered, ranked, or aggregated tabular data
* **AI-written narrative** — an executive summary with key findings, usually organized around the story of the analysis
* **Report metadata** — the project context, layer and feature counts, and generation date
You control the composition in plain language. For example, ask for *"an HTML report with the map, the revenue chart, and a short executive summary"* — or request a Word document or a slide deck instead. The AI assembles the sections and follows a professional layout for each format.
## Generate a report
Run your spatial analysis until the results are ready to present — a scored site-selection layer, a coverage-gap study, a property heatmap, or any other output. The current map layers, charts, and conversation become the source material.
In the chat, describe the deliverable: *"Create an HTML report of this analysis"*, *"generate a Word report"*, or *"make a PPT presentation"*. Mention what to include — the map, a specific chart, a data table, or the key findings.
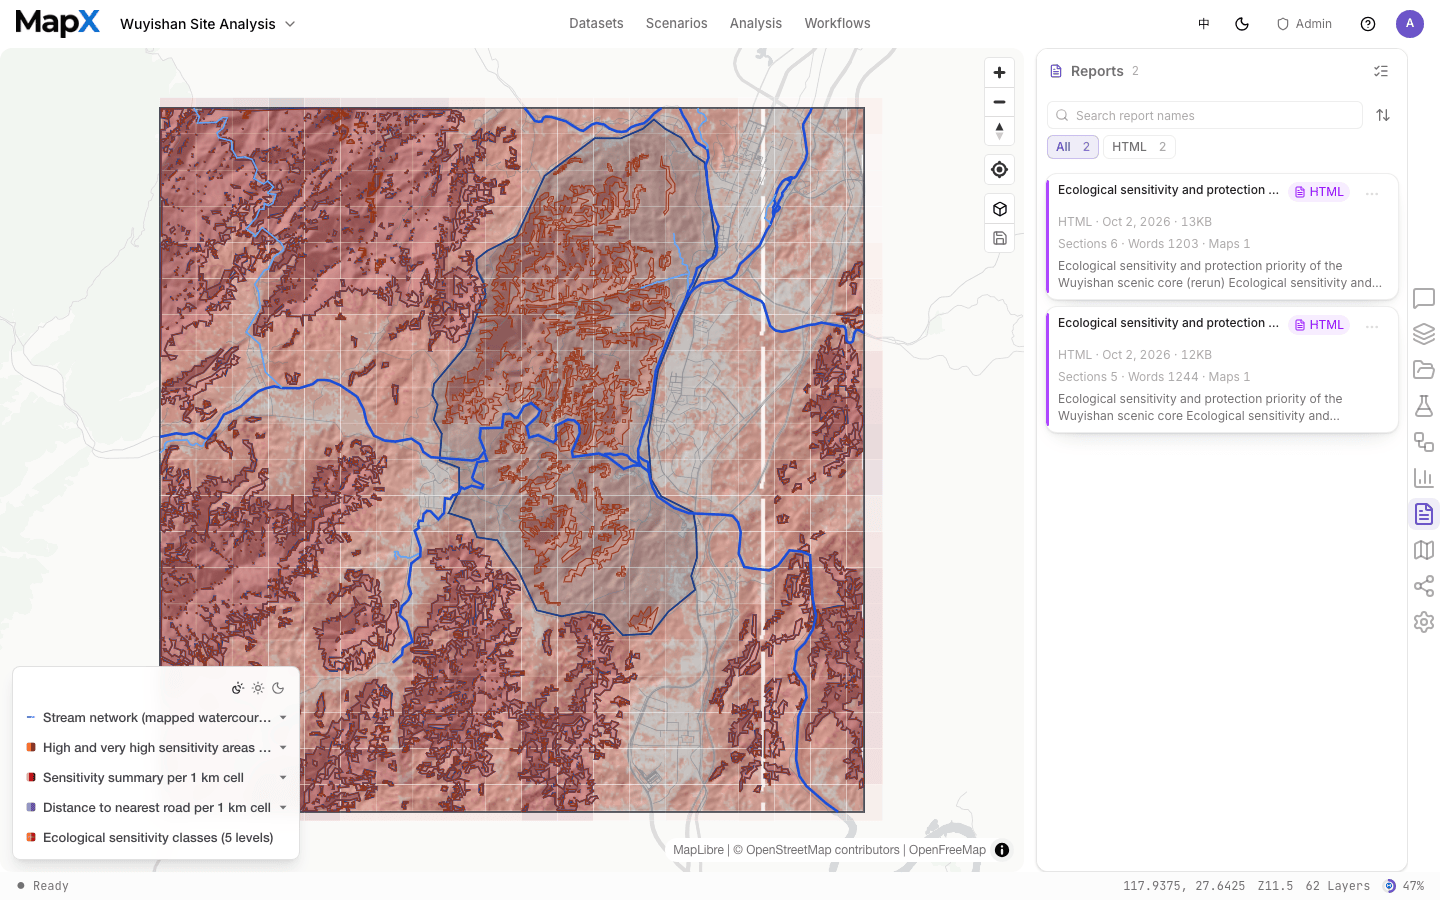
The generated report appears in the **Reports** panel as a card showing its format, date, and file size, plus a quick inventory — sections, words, and maps — so you can tell two revisions apart at a glance. Chat messages that generate reports include a **Preview report** action that opens the report canvas directly.
 ## Preview, revise, and version reports
Reports open in a canvas inside the map container. The canvas toolbar lets you return to the map, open the report in a new window, download the file, or export a PDF.
## Preview, revise, and version reports
Reports open in a canvas inside the map container. The canvas toolbar lets you return to the map, open the report in a new window, download the file, or export a PDF.
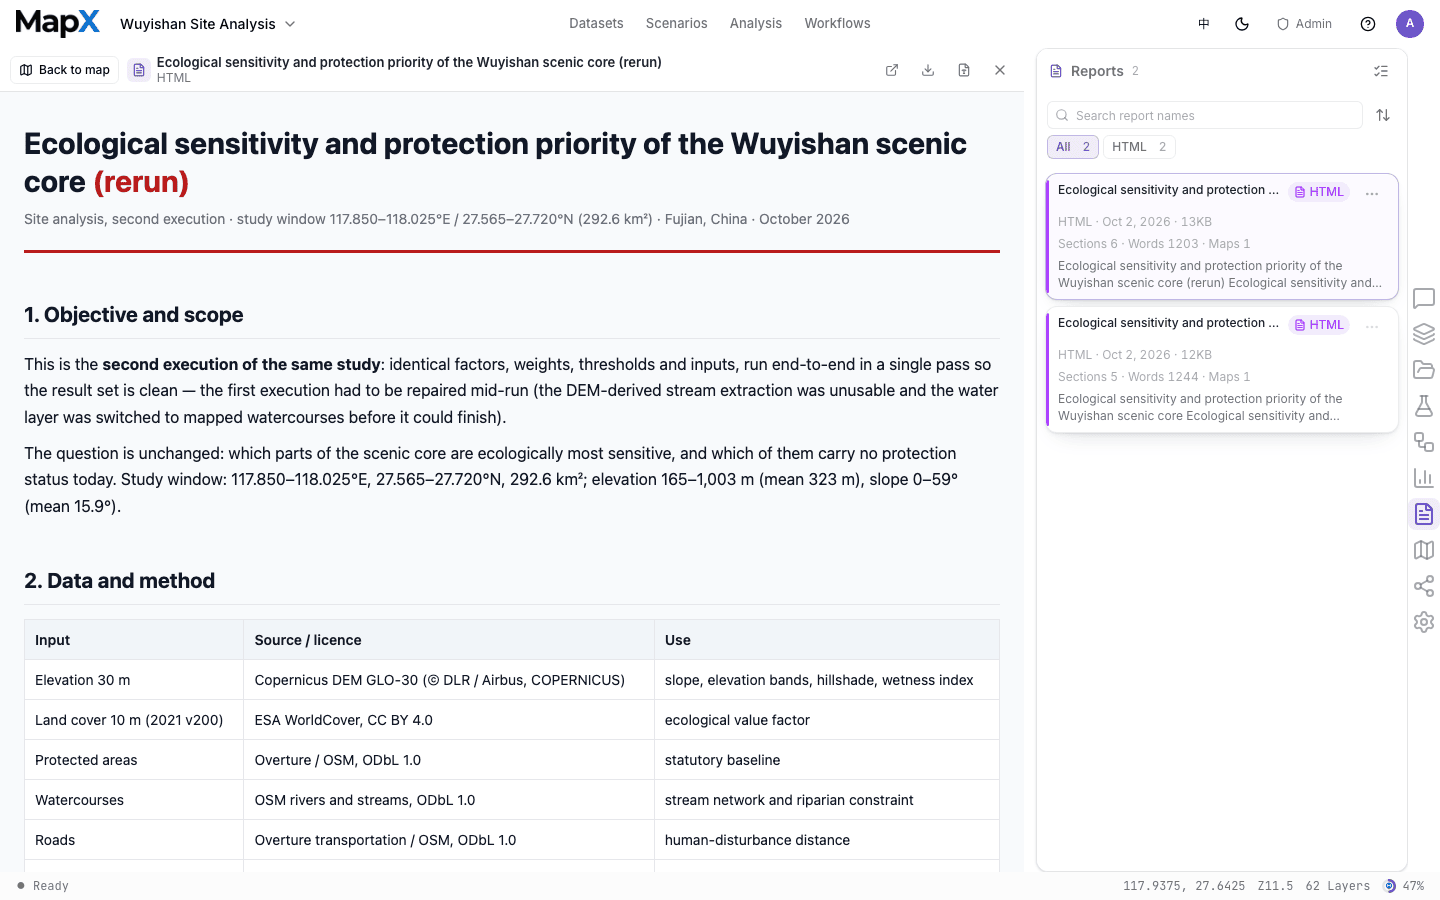 * **Formats** — HTML, Word, and PPT files render as in-canvas previews. PDF is produced as an export; use **Export PDF** from the report actions or the canvas toolbar.
* **Revise with the AI** — select text in the report canvas, then tell the AI what to change (rewrite, shorten, rephrase) or type an instruction in the chat while the report is attached. The AI revises the report in place.
* **Versions** — every revision is saved as a new version. Use the version switcher in the canvas header to compare `v1`, `v2`, and later revisions, or return to an earlier version.
* **Reference reports in chat** — type `/` and choose a report to attach its latest version to your next message, for example when asking for a PDF export or further changes.
## Export and share
* **Download** — download the report file directly (`.html`, `.docx`, or `.pptx`).
* **Export PDF** — convert a report to PDF from the report actions menu or the canvas toolbar.
* **Batch PDF export** — select multiple reports in the Reports panel and export them together. Progress appears in the task tray at the bottom right, where you can cancel, retry, or download each completed file.
* **Share by link** — open the **Share** panel and use **Report Share** to create a public or password-protected URL. Recipients can open it in any browser without a MapX account. Links stay active as long as the project exists, and you can revoke them at any time.
The next time a client asks for an update, send a report link instead of a folder of screenshots. Recipients get a professional document they can explore — and you spend zero time on formatting. For attachments, download the HTML, Word, or PPT file directly.
Report generation, preview, download, and link sharing are available on all plans, including Free.
This documentation is built and hosted on [Mintlify](https://mintlify.com), a developer documentation platform.
* **Formats** — HTML, Word, and PPT files render as in-canvas previews. PDF is produced as an export; use **Export PDF** from the report actions or the canvas toolbar.
* **Revise with the AI** — select text in the report canvas, then tell the AI what to change (rewrite, shorten, rephrase) or type an instruction in the chat while the report is attached. The AI revises the report in place.
* **Versions** — every revision is saved as a new version. Use the version switcher in the canvas header to compare `v1`, `v2`, and later revisions, or return to an earlier version.
* **Reference reports in chat** — type `/` and choose a report to attach its latest version to your next message, for example when asking for a PDF export or further changes.
## Export and share
* **Download** — download the report file directly (`.html`, `.docx`, or `.pptx`).
* **Export PDF** — convert a report to PDF from the report actions menu or the canvas toolbar.
* **Batch PDF export** — select multiple reports in the Reports panel and export them together. Progress appears in the task tray at the bottom right, where you can cancel, retry, or download each completed file.
* **Share by link** — open the **Share** panel and use **Report Share** to create a public or password-protected URL. Recipients can open it in any browser without a MapX account. Links stay active as long as the project exists, and you can revoke them at any time.
The next time a client asks for an update, send a report link instead of a folder of screenshots. Recipients get a professional document they can explore — and you spend zero time on formatting. For attachments, download the HTML, Word, or PPT file directly.
Report generation, preview, download, and link sharing are available on all plans, including Free.
This documentation is built and hosted on [Mintlify](https://mintlify.com), a developer documentation platform.