> ## Documentation Index
> Fetch the complete documentation index at: https://docs.mapxagent.com/llms.txt
> Use this file to discover all available pages before exploring further.
# Urban Growth Monitor · Hanoi
> Reconstruct Hanoi's built-up expansion phase by phase, measure how much is infill versus outward growth, and connect growth to population and night lights.
Urban Growth Monitor asks three questions a growth-management plan needs to answer: **how fast is the city expanding, where is it going, and is the growth compact or sprawling?** It reconstructs the expansion phase by phase, separates infill from edge and outlying growth, and overlays population and night lights to find where growth and activity disagree.
 ## What the scenario ships
Seven layers cover the Hanoi window. Only the built-up area is visible by default; the rest are context and analysis inputs.
| Layer | Data | Role in the study |
| - | - | - |
| Road network | OSM roads | Test whether new built-up land follows the main axes |
| Watercourses | OSM waterways, 2,565 lines | River corridors as a growth constraint |
| Administrative boundaries | 50 ADM3 units | Attribution and cross tables |
| Built-up area | GHSL 2020 density, max 7,967 m²/cell (visible) | Growth-intensity backdrop |
| Built-up history | WSF Evolution 1985–2015 build year, 733k valid cells | The phase and form source |
| Population | WorldPop 2020 | Demand and activity axis |
| Night lights | VIIRS, December 2017 median, 611 m | Economic-activity proxy |
*All layers come from the [built-in catalog](/en/concepts/builtin-datasets) with source and attribution attached, and they are not limited to Hanoi: the catalog provides the same datasets for other cities at the same specification — switch the study area, add the same entries, and this chapter's method chain transfers in minutes.*
## How the study works
| Stage | Question | What MapX runs | Output |
| - | - | - | - |
| 1. Reconstruct the expansion | How much built-up land was added in each period? | Expansion metrics (`periodBreaks` 1990 / 2000 / 2010 / 2015), Raster class area, Land change matrix | Phase table with new area, annual growth, intensity and compactness; built-year cross table |
| 2. Measure the form | Is new growth infill, edge expansion or outlying? | Landscape expansion index on two built-up masks, Raster to polygons, Mean centre, Standard deviational ellipse, Directional distribution, Buffer and zonal summary | Infill / edge / outlying layer, centre shift and ellipse, share of new built-up near roads and waterways |
| 3. Connect to activity | Where do population and night lights diverge? | Grid at 1 km, Zonal statistics, Quadrant (median split) | Population × night-light quadrants and the growth-management targets |
In short, the study first reconstructs built-up expansion phase by phase, measuring new area, speed and intensity per period; it then classifies each new patch as infill, edge or leapfrog from how it touches the earlier built-up mask, and describes direction with the gravity centre and a standard deviational ellipse; finally it crosses growth with population and night lights in a quadrant grid to flag growth-management priorities, delivering phase layers, indicator tables and a report.
## Run it
The screenshots below come from this scenario's reference workspace. Each step names the platform surface it uses, so you can follow the same path in your own project.
**Suggested question:** *"Run an urban-growth monitoring study for Hanoi: reconstruct the staged expansion of built-up land, analyse its speed, direction and intensity, flag the main growth-management issues with boundary guidance; deliver layers, charts and a report."*
### 1. Open the scenario
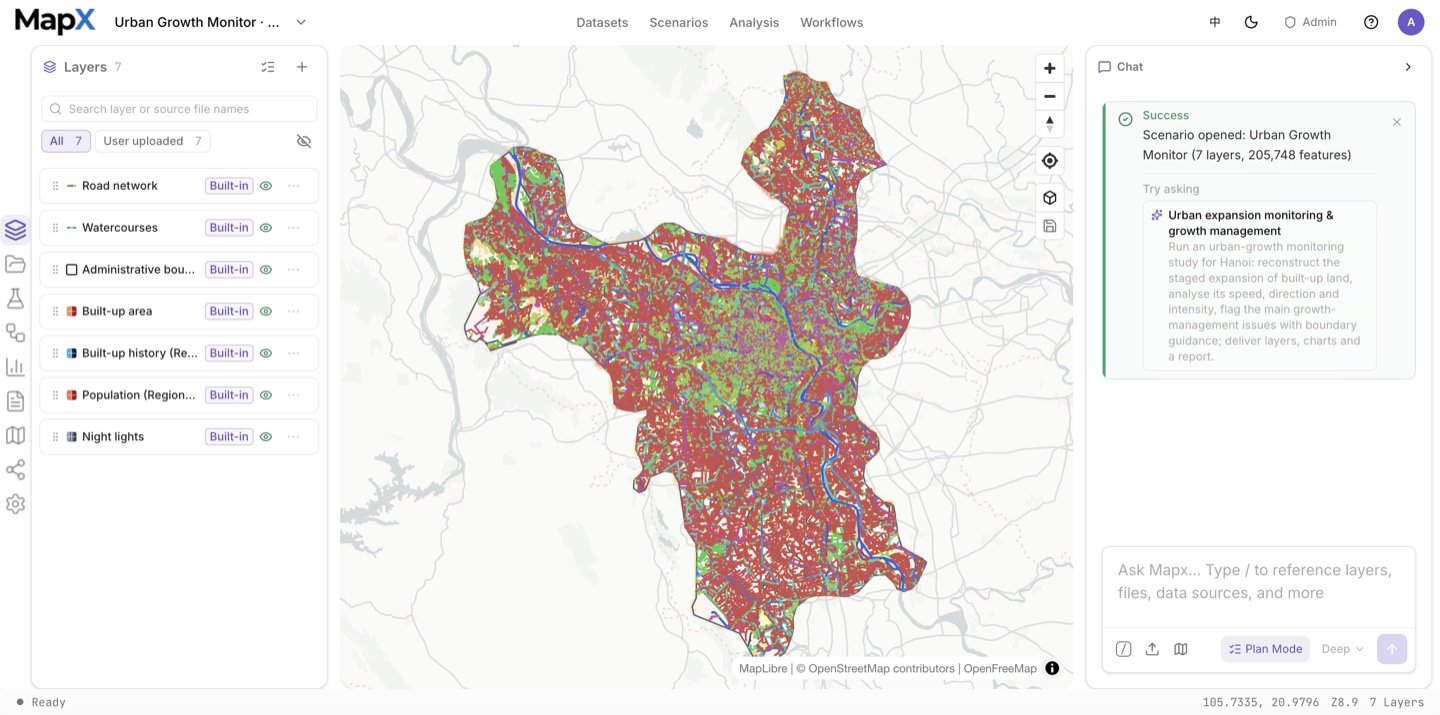
Open **Scenarios** in the top menu, select this card and choose **Open scenario**. The whole bundle imports at once: every layer keeps its default style, legend, source and attribution, and the camera flies to the study area. Use the **Layers** panel to switch layers on and off before you type anything.
## What the scenario ships
Seven layers cover the Hanoi window. Only the built-up area is visible by default; the rest are context and analysis inputs.
| Layer | Data | Role in the study |
| - | - | - |
| Road network | OSM roads | Test whether new built-up land follows the main axes |
| Watercourses | OSM waterways, 2,565 lines | River corridors as a growth constraint |
| Administrative boundaries | 50 ADM3 units | Attribution and cross tables |
| Built-up area | GHSL 2020 density, max 7,967 m²/cell (visible) | Growth-intensity backdrop |
| Built-up history | WSF Evolution 1985–2015 build year, 733k valid cells | The phase and form source |
| Population | WorldPop 2020 | Demand and activity axis |
| Night lights | VIIRS, December 2017 median, 611 m | Economic-activity proxy |
*All layers come from the [built-in catalog](/en/concepts/builtin-datasets) with source and attribution attached, and they are not limited to Hanoi: the catalog provides the same datasets for other cities at the same specification — switch the study area, add the same entries, and this chapter's method chain transfers in minutes.*
## How the study works
| Stage | Question | What MapX runs | Output |
| - | - | - | - |
| 1. Reconstruct the expansion | How much built-up land was added in each period? | Expansion metrics (`periodBreaks` 1990 / 2000 / 2010 / 2015), Raster class area, Land change matrix | Phase table with new area, annual growth, intensity and compactness; built-year cross table |
| 2. Measure the form | Is new growth infill, edge expansion or outlying? | Landscape expansion index on two built-up masks, Raster to polygons, Mean centre, Standard deviational ellipse, Directional distribution, Buffer and zonal summary | Infill / edge / outlying layer, centre shift and ellipse, share of new built-up near roads and waterways |
| 3. Connect to activity | Where do population and night lights diverge? | Grid at 1 km, Zonal statistics, Quadrant (median split) | Population × night-light quadrants and the growth-management targets |
In short, the study first reconstructs built-up expansion phase by phase, measuring new area, speed and intensity per period; it then classifies each new patch as infill, edge or leapfrog from how it touches the earlier built-up mask, and describes direction with the gravity centre and a standard deviational ellipse; finally it crosses growth with population and night lights in a quadrant grid to flag growth-management priorities, delivering phase layers, indicator tables and a report.
## Run it
The screenshots below come from this scenario's reference workspace. Each step names the platform surface it uses, so you can follow the same path in your own project.
**Suggested question:** *"Run an urban-growth monitoring study for Hanoi: reconstruct the staged expansion of built-up land, analyse its speed, direction and intensity, flag the main growth-management issues with boundary guidance; deliver layers, charts and a report."*
### 1. Open the scenario
Open **Scenarios** in the top menu, select this card and choose **Open scenario**. The whole bundle imports at once: every layer keeps its default style, legend, source and attribution, and the camera flies to the study area. Use the **Layers** panel to switch layers on and off before you type anything.
 ### 2. Ask the suggested question and review the plan
Send the **suggested question** in the box above — or edit it first. [Plan mode](/en/concepts/plan-mode) confirms the study area, the two mask years used for the form measurement and the report numbers before anything runs.
### 2. Ask the suggested question and review the plan
Send the **suggested question** in the box above — or edit it first. [Plan mode](/en/concepts/plan-mode) confirms the study area, the two mask years used for the form measurement and the report numbers before anything runs.
 ### 3. Approve the plan and run the analysis
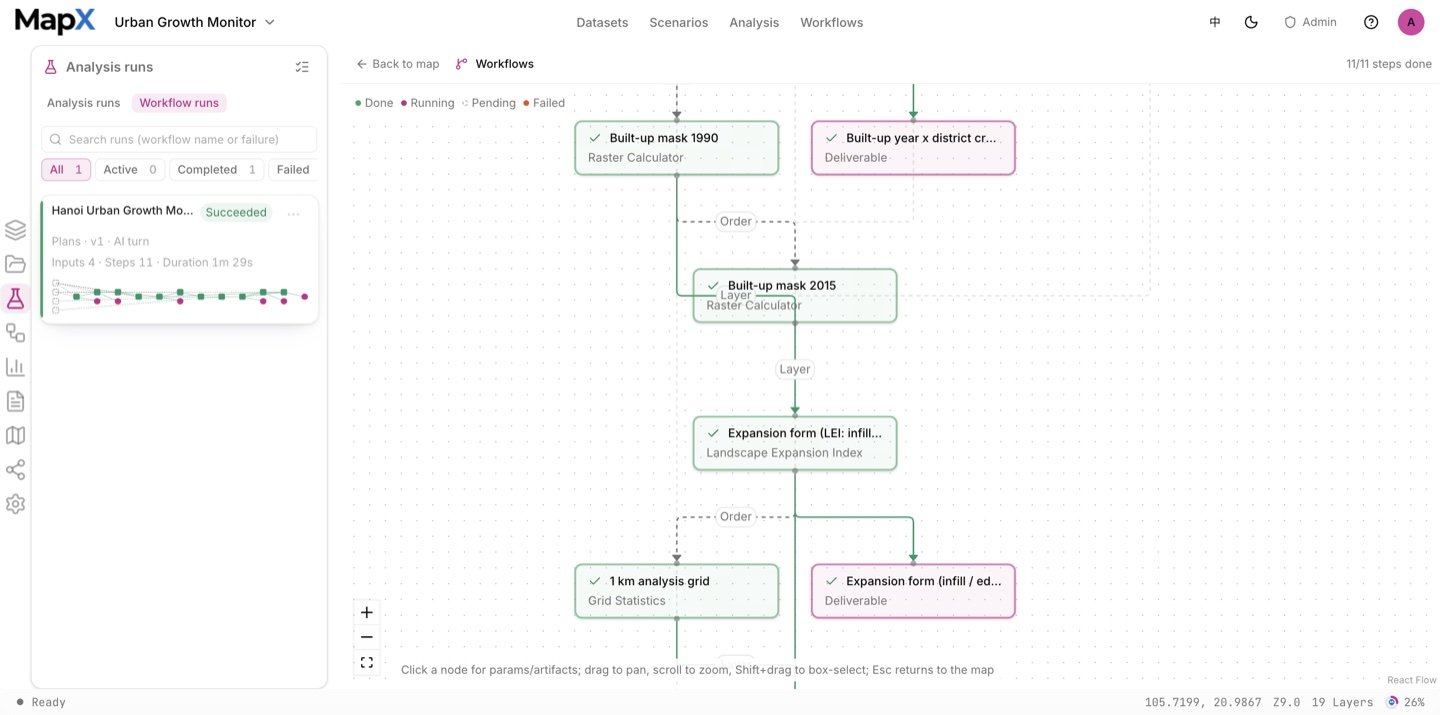
The run chains deterministic [analysis](/en/concepts/analysis) tools: the phased expansion metrics, the landscape expansion index between the two built-up masks, polygon conversion for the form layer, the gravity centre and standard deviational ellipse, and the 1 km grid with population and night-light quadrants. The **Analysis** panel keeps every run's operator, inputs, parameters and result layer, and the workflow graph in the centre visualises the whole chain.
### 3. Approve the plan and run the analysis
The run chains deterministic [analysis](/en/concepts/analysis) tools: the phased expansion metrics, the landscape expansion index between the two built-up masks, polygon conversion for the form layer, the gravity centre and standard deviational ellipse, and the 1 km grid with population and night-light quadrants. The **Analysis** panel keeps every run's operator, inputs, parameters and result layer, and the workflow graph in the centre visualises the whole chain.
 ### 4. Style the result on the map
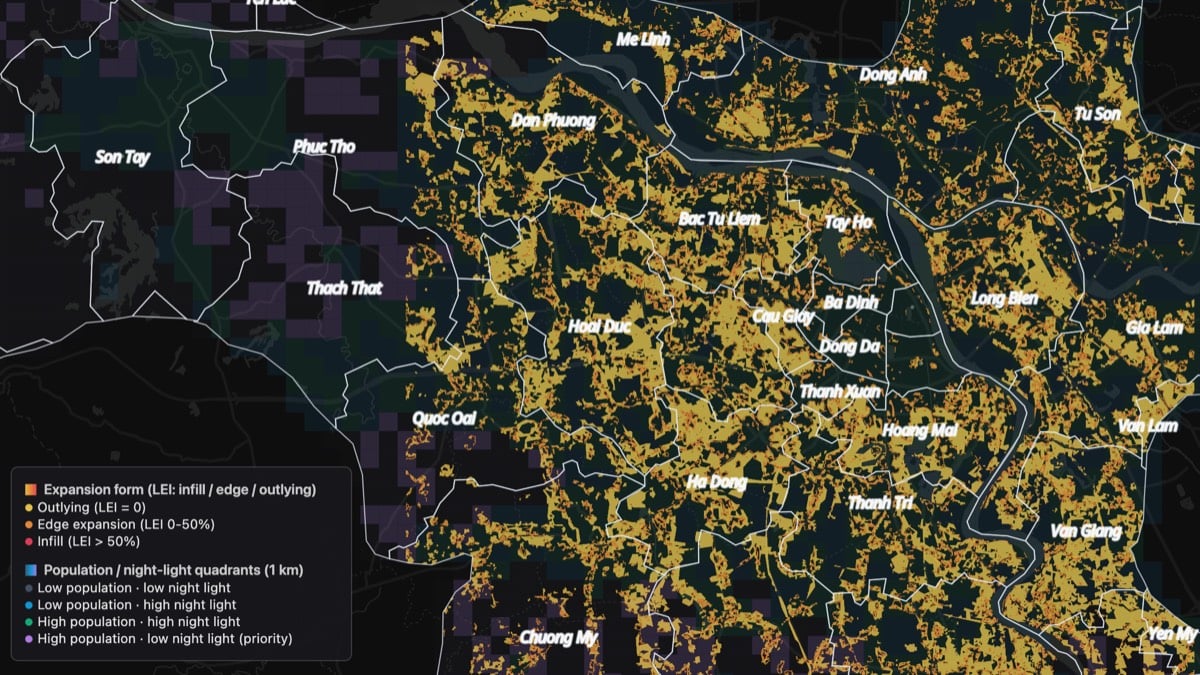
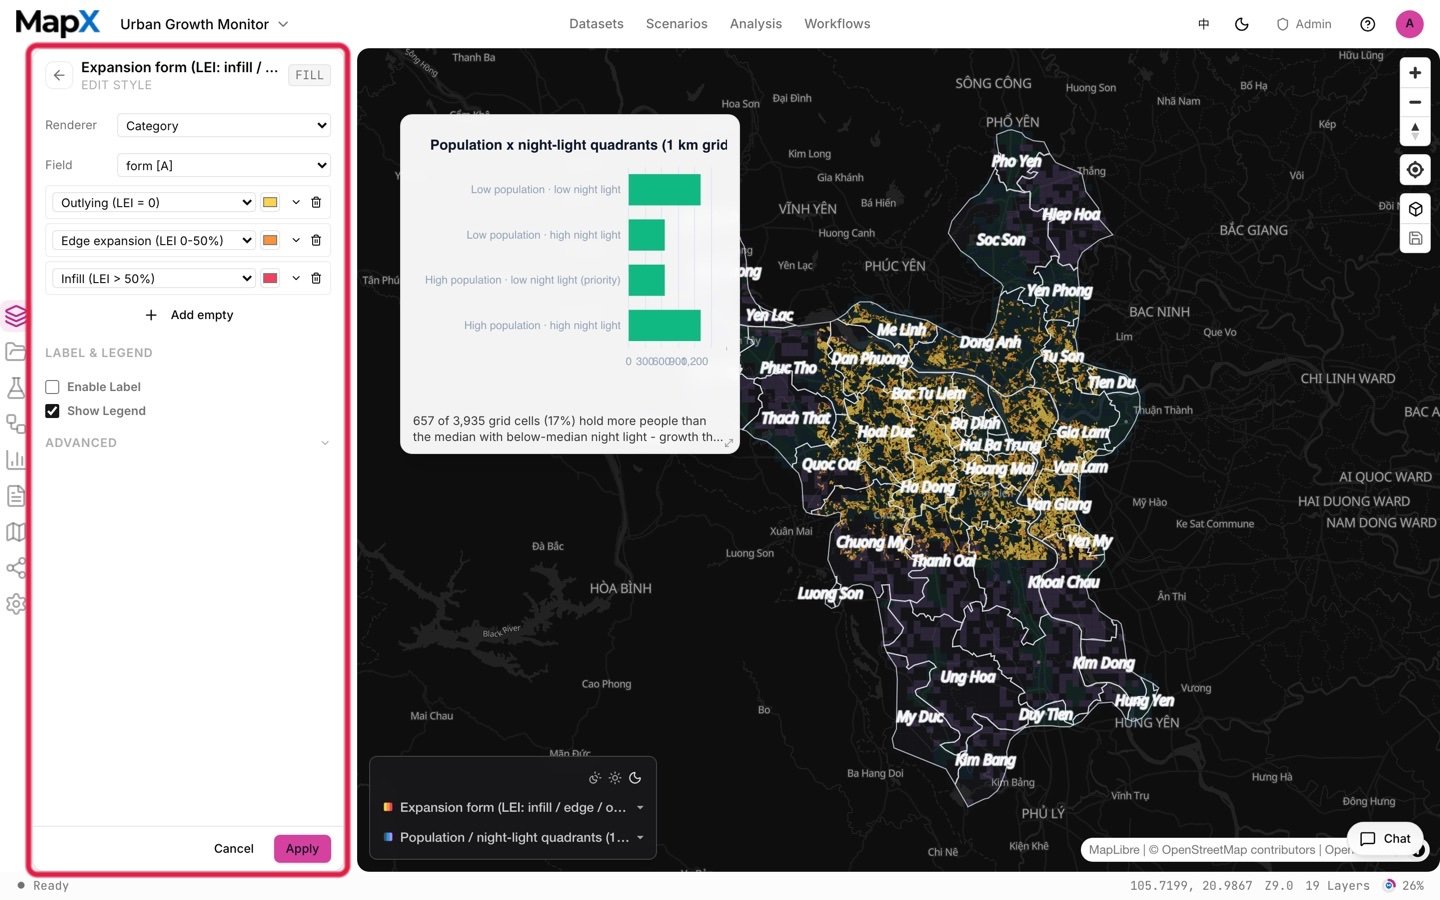
The expansion-form layer keeps three human-readable classes on the dark basemap, with the quadrant grid and district labels as light references; the layer style editor is where the hue family and label halo are set.
### 4. Style the result on the map
The expansion-form layer keeps three human-readable classes on the dark basemap, with the quadrant grid and district labels as light references; the layer style editor is where the hue family and label halo are set.
 ### 5. Turn the result into charts and a report
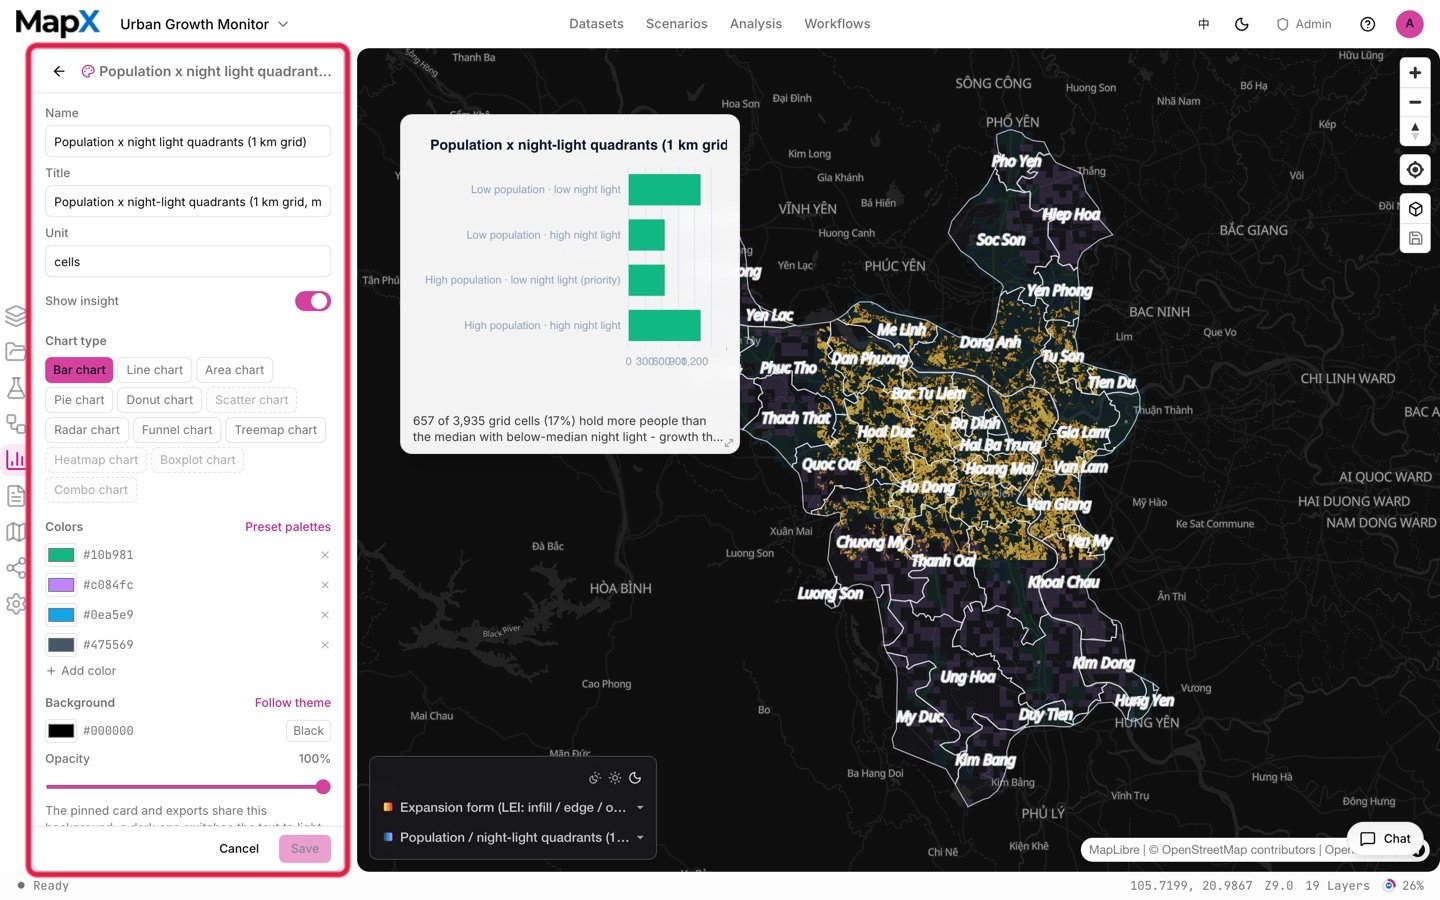
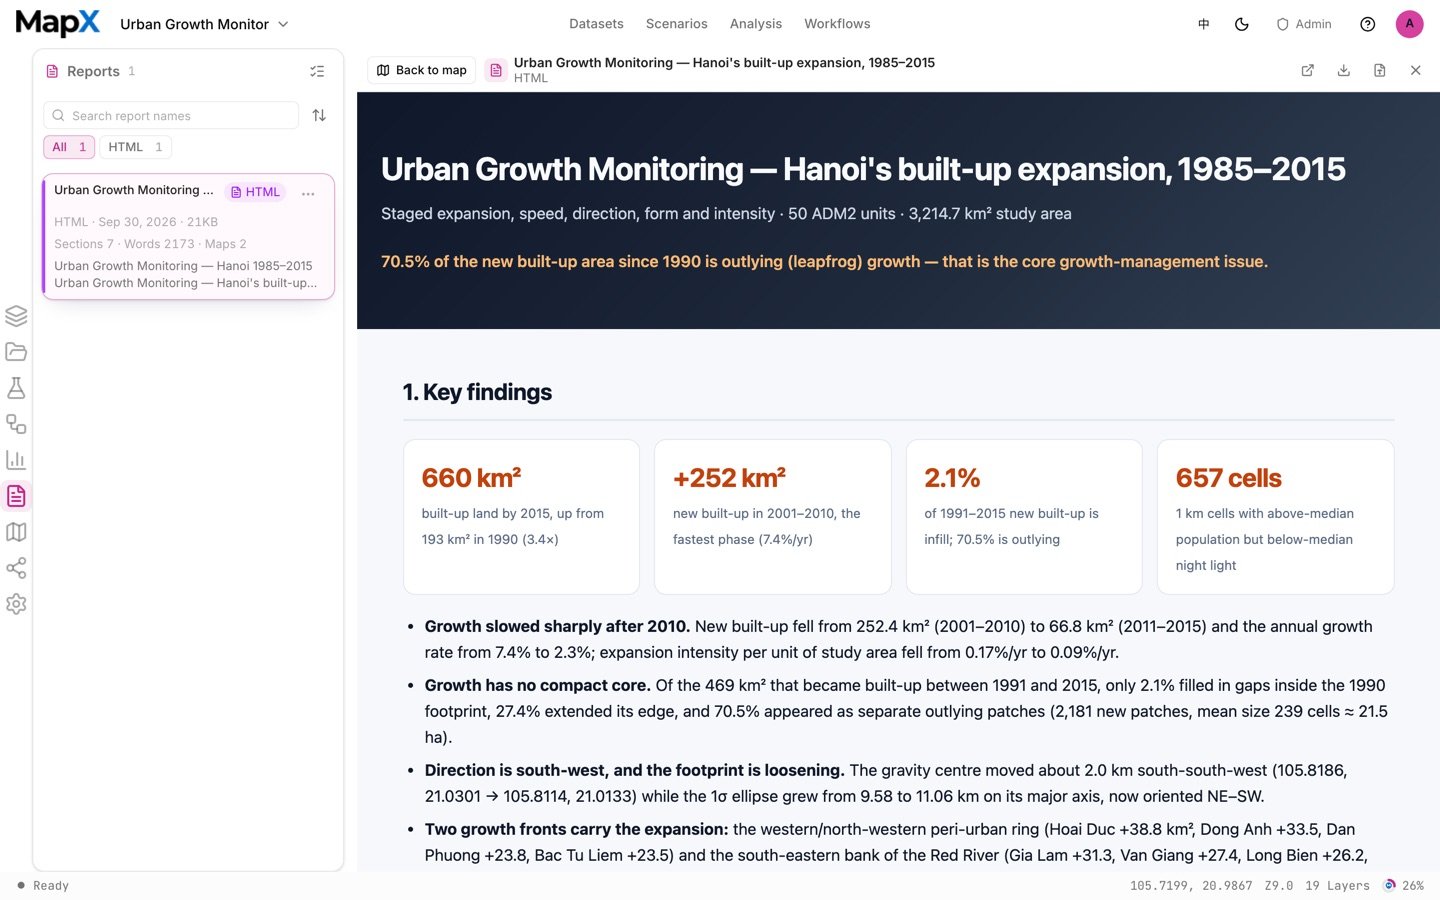
The run produces a dual-axis growth chart, a form-composition donut and a quadrant distribution. All are **[charts](/en/concepts/charts)** you can restyle or pin, and the **[report](/en/concepts/reports)** records the phase table, the form shares and the year-mismatch caveats.
### 5. Turn the result into charts and a report
The run produces a dual-axis growth chart, a form-composition donut and a quadrant distribution. All are **[charts](/en/concepts/charts)** you can restyle or pin, and the **[report](/en/concepts/reports)** records the phase table, the form shares and the year-mismatch caveats.
 ## Example output
The screenshots above come from one example run with the default settings on the shipped data. They show the shape of the deliverables, not what your run will return.
A finished run hands back a named, reusable set of deliverables instead of a single map:
* **Layers** — the expansion-form layer (infill, edge, outlying), the population and night-light quadrant grid, the phase rasters as context and a labelled district reference.
* **Tables** — the phase metrics (new area, annual growth, intensity, compactness, centre and ellipse) and the built-year cross table.
* **Charts** — the phase growth chart, the expansion-form donut and the quadrant distribution.
* **Report** — the growth-monitoring document with the phase definitions and the reference-year caveats.
The layer names follow the run language, but the deliverable set is stable enough to plan a handover around.
## Related
* [Scenarios](/en/concepts/scenarios) — the full catalog and how scenarios work
* [Development Suitability Baseline](/en/concepts/scenarios/development-suitability-baseline) — where growth can be steered
* [Public Facility Siting](/en/concepts/scenarios/public-facility-siting) — siting the services that follow growth
* [Charts](/en/concepts/charts) — dual-axis, donut and ranking views
* [Reports](/en/concepts/reports) — packaging the growth-management reading
This documentation is built and hosted on [Mintlify](https://mintlify.com), a developer documentation platform.
## Example output
The screenshots above come from one example run with the default settings on the shipped data. They show the shape of the deliverables, not what your run will return.
A finished run hands back a named, reusable set of deliverables instead of a single map:
* **Layers** — the expansion-form layer (infill, edge, outlying), the population and night-light quadrant grid, the phase rasters as context and a labelled district reference.
* **Tables** — the phase metrics (new area, annual growth, intensity, compactness, centre and ellipse) and the built-year cross table.
* **Charts** — the phase growth chart, the expansion-form donut and the quadrant distribution.
* **Report** — the growth-monitoring document with the phase definitions and the reference-year caveats.
The layer names follow the run language, but the deliverable set is stable enough to plan a handover around.
## Related
* [Scenarios](/en/concepts/scenarios) — the full catalog and how scenarios work
* [Development Suitability Baseline](/en/concepts/scenarios/development-suitability-baseline) — where growth can be steered
* [Public Facility Siting](/en/concepts/scenarios/public-facility-siting) — siting the services that follow growth
* [Charts](/en/concepts/charts) — dual-axis, donut and ranking views
* [Reports](/en/concepts/reports) — packaging the growth-management reading
This documentation is built and hosted on [Mintlify](https://mintlify.com), a developer documentation platform.