> ## Documentation Index
> Fetch the complete documentation index at: https://docs.mapxagent.com/llms.txt
> Use this file to discover all available pages before exploring further.
# MapX: AI-Powered Spatial Data Exploration
> MapX is a browser-based, AI-driven spatial data exploration platform. Bring in data, ask questions in plain language, and get interactive maps, charts, and professional reports in seconds — no GIS software required.
Traditional spatial analysis tools such as ArcGIS and QGIS are powerful, yet they demand desktop installation, licences, and weeks of training just to answer a basic location question. MapX moves spatial analysis into the browser and replaces that workflow with an AI conversation: bring your data in, describe what you want to know, and MapX selects and runs the right spatial operation, then renders the result as an interactive map layer.
MapX is more than a question-to-map tool. It is a workspace that covers the whole analysis journey — data access, spatial analysis, visualization, charts, reports, sharing, and collaboration — all inside one project. It is built for analysts, planners, and business teams who need GIS-grade results without becoming GIS experts, and it opens the same capabilities to developers through the REST API, CLI, MCP, and skills.
 ## What You Can Do with MapX
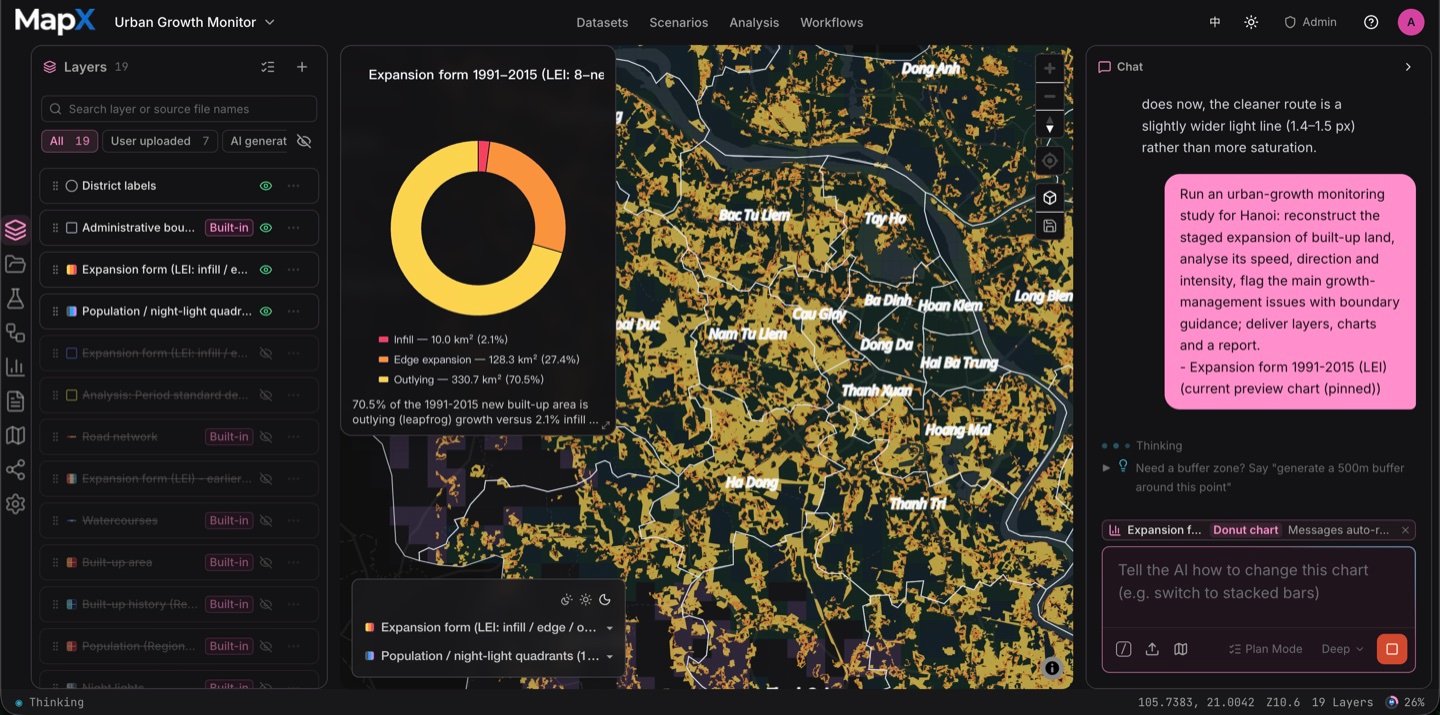
Ask spatial questions in plain English — buffers, overlays, spatial joins, heatmaps, site scoring — and MapX picks the right operation and renders the result in seconds. Keep asking follow-ups to refine the analysis; no query language or scripting required.
Import CSV, Excel, GeoJSON, Shapefile, and GeoTIFF files, plus text, Word, and PDF documents for analysis. MapX auto-detects latitude/longitude columns and geocodes addresses on Basic and above, processes uploads in the background, and accepts single files up to 20 GB on paid plans. You can also connect [PostgreSQL and MySQL databases](/en/concepts/database-connections) and turn PostGIS tables into live layers.
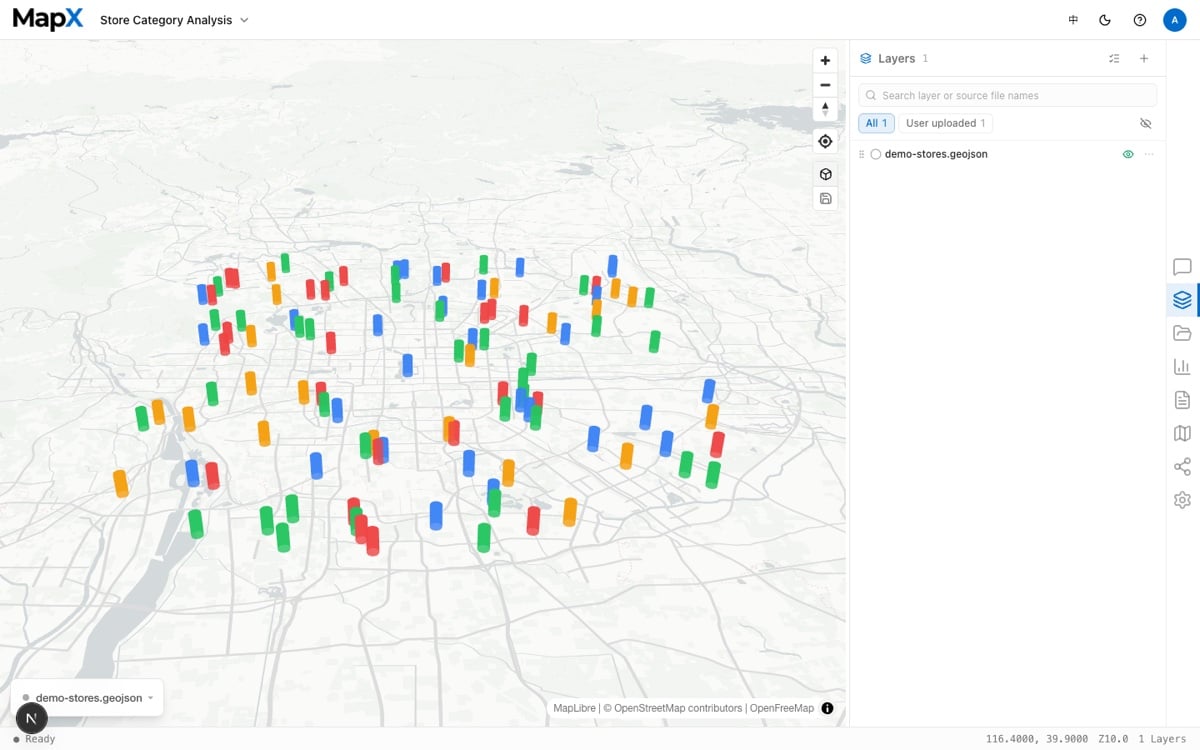
Manage every dataset and analysis result as a named layer. Style by any field with colors, labels, symbols, and transparency, then switch points, lines, and polygons into 3D columns, elevated paths, or extruded surfaces with one click. Large layers stream in progressively, so interaction stays smooth.
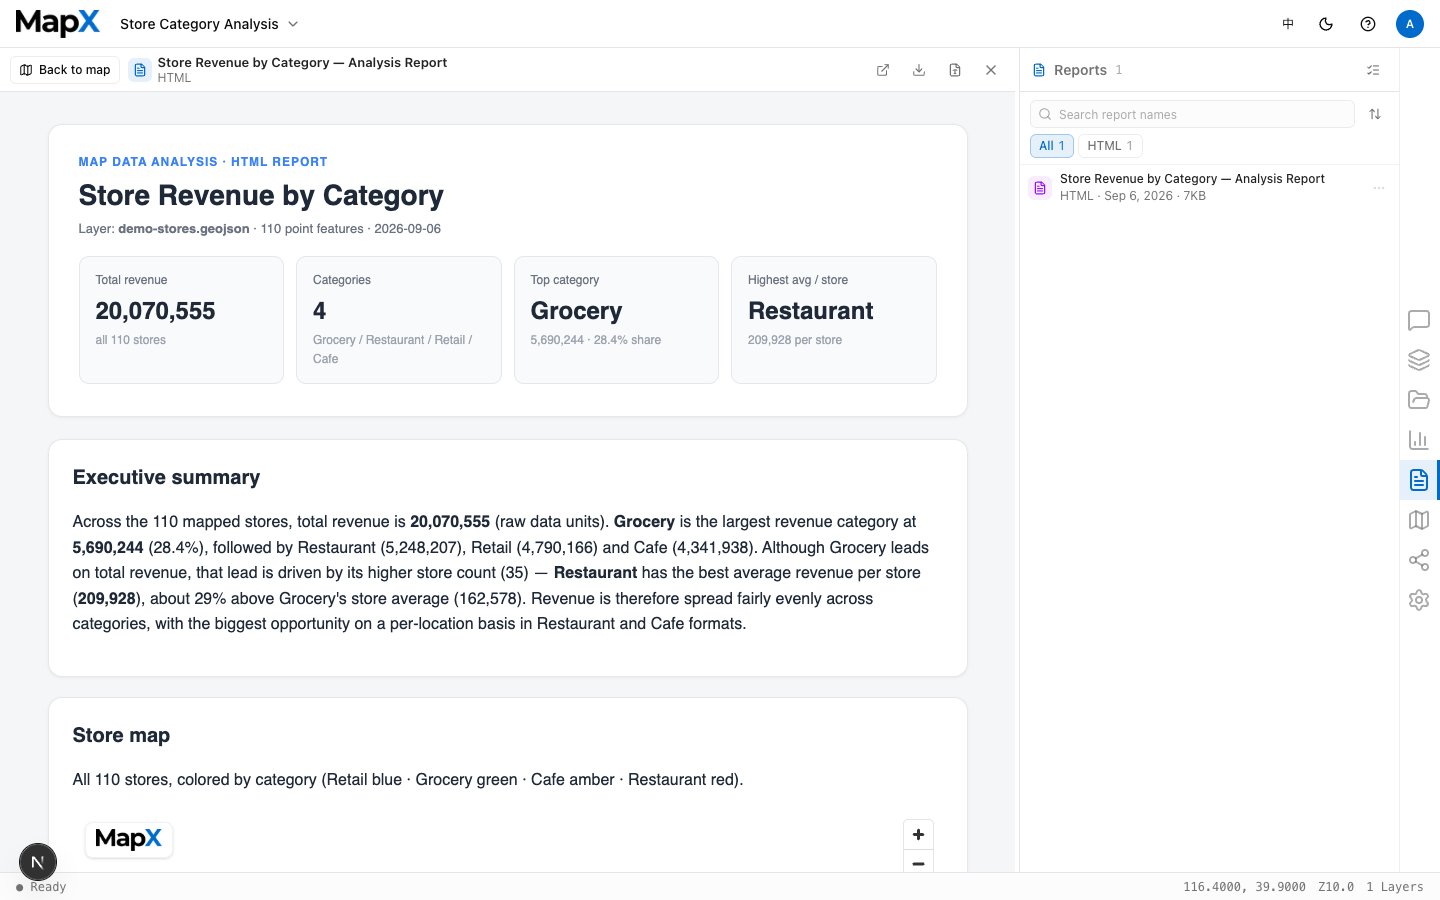
Generate charts from layers and files, pin them to the map, and export them. Package an analysis into a self-contained HTML report with interactive maps, charts, and AI-written insights, then share it by link or download it.
Hand results to anyone who needs them: share report links, embed an interactive map on a website, generate social-ready images, or open project access to team members.
Integrate MapX into your own product through the REST API and mapx CLI. Connect external tools over MCP, upload skills to codify team workflows, and add knowledge bases so the AI answers from your own material.
## From Question to Deliverable
A typical MapX workflow runs from raw data to a client-ready deliverable:
Upload files or connect a database. MapX detects location columns and renders a layer in seconds. See [uploading data](/en/uploading-data) and [database connections](/en/concepts/database-connections).
Describe your goal — filter, buffer, overlay, score, or visualize — and MapX executes it. Follow up to refine the result. See [AI chat](/en/concepts/ai-chat) and [analysis](/en/concepts/analysis).
Adjust styles, labels, and transparency, switch between 2D and 3D, and generate charts that pin to the map. See [layers](/en/concepts/layers), [3D view](/en/concepts/3d-view), and [charts](/en/concepts/charts).
## What You Can Do with MapX
Ask spatial questions in plain English — buffers, overlays, spatial joins, heatmaps, site scoring — and MapX picks the right operation and renders the result in seconds. Keep asking follow-ups to refine the analysis; no query language or scripting required.
Import CSV, Excel, GeoJSON, Shapefile, and GeoTIFF files, plus text, Word, and PDF documents for analysis. MapX auto-detects latitude/longitude columns and geocodes addresses on Basic and above, processes uploads in the background, and accepts single files up to 20 GB on paid plans. You can also connect [PostgreSQL and MySQL databases](/en/concepts/database-connections) and turn PostGIS tables into live layers.
Manage every dataset and analysis result as a named layer. Style by any field with colors, labels, symbols, and transparency, then switch points, lines, and polygons into 3D columns, elevated paths, or extruded surfaces with one click. Large layers stream in progressively, so interaction stays smooth.
Generate charts from layers and files, pin them to the map, and export them. Package an analysis into a self-contained HTML report with interactive maps, charts, and AI-written insights, then share it by link or download it.
Hand results to anyone who needs them: share report links, embed an interactive map on a website, generate social-ready images, or open project access to team members.
Integrate MapX into your own product through the REST API and mapx CLI. Connect external tools over MCP, upload skills to codify team workflows, and add knowledge bases so the AI answers from your own material.
## From Question to Deliverable
A typical MapX workflow runs from raw data to a client-ready deliverable:
Upload files or connect a database. MapX detects location columns and renders a layer in seconds. See [uploading data](/en/uploading-data) and [database connections](/en/concepts/database-connections).
Describe your goal — filter, buffer, overlay, score, or visualize — and MapX executes it. Follow up to refine the result. See [AI chat](/en/concepts/ai-chat) and [analysis](/en/concepts/analysis).
Adjust styles, labels, and transparency, switch between 2D and 3D, and generate charts that pin to the map. See [layers](/en/concepts/layers), [3D view](/en/concepts/3d-view), and [charts](/en/concepts/charts).
 Generate a report, share a link or an embed, export an image, or hand access to a team member. See [reports](/en/concepts/reports) and [sharing](/en/sharing/sharing-maps).
 ## Who Uses MapX
**Site selection analysts** score candidate locations against catchment demographics, competitor distance, and infrastructure access — work that previously required a dedicated GIS team.
**Real estate teams** overlay planning boundaries, transport links, and market data to qualify leads, prepare presentation materials, and answer location questions on the spot.
**Logistics planners** optimize delivery areas, flag coverage gaps, and model the impact of adding or removing depots — without writing a single line of code.
**Energy and environmental consultants** combine imagery and land-use layers with asset registers and regulatory boundaries for impact assessments, and deliver maps and reports in minutes instead of days.
## MapX vs. Traditional GIS
| | MapX | Traditional GIS (ArcGIS / QGIS) |
| - | - | - |
| **Setup** | Runs in the browser — nothing to install | Desktop installation, licences, and configuration |
| **Learning curve** | Plain-language prompts | Formal GIS training required |
| **Analysis speed** | Seconds through conversation | Manual toolchains — minutes to hours |
| **Data access** | Multi-format uploads plus PostgreSQL / MySQL / PostGIS connections | Mostly desktop file imports |
| **Delivery & collaboration** | Links, embeds, reports, and project sharing | File exports and manual distribution |
| **Open capabilities** | REST API, CLI, MCP, and skills | Desktop scripting and plugins |
| **Cost** | Free tier; paid plans from \$29/mo | Traditional desktop licences typically cost hundreds of dollars per seat per year |
The fastest way to understand MapX is to try it. Open the [Quickstart](/en/quickstart) guide and complete your first spatial analysis in under a minute — no credit card required.
This documentation is built and hosted on [Mintlify](https://mintlify.com), a developer documentation platform.
## Who Uses MapX
**Site selection analysts** score candidate locations against catchment demographics, competitor distance, and infrastructure access — work that previously required a dedicated GIS team.
**Real estate teams** overlay planning boundaries, transport links, and market data to qualify leads, prepare presentation materials, and answer location questions on the spot.
**Logistics planners** optimize delivery areas, flag coverage gaps, and model the impact of adding or removing depots — without writing a single line of code.
**Energy and environmental consultants** combine imagery and land-use layers with asset registers and regulatory boundaries for impact assessments, and deliver maps and reports in minutes instead of days.
## MapX vs. Traditional GIS
| | MapX | Traditional GIS (ArcGIS / QGIS) |
| - | - | - |
| **Setup** | Runs in the browser — nothing to install | Desktop installation, licences, and configuration |
| **Learning curve** | Plain-language prompts | Formal GIS training required |
| **Analysis speed** | Seconds through conversation | Manual toolchains — minutes to hours |
| **Data access** | Multi-format uploads plus PostgreSQL / MySQL / PostGIS connections | Mostly desktop file imports |
| **Delivery & collaboration** | Links, embeds, reports, and project sharing | File exports and manual distribution |
| **Open capabilities** | REST API, CLI, MCP, and skills | Desktop scripting and plugins |
| **Cost** | Free tier; paid plans from \$29/mo | Traditional desktop licences typically cost hundreds of dollars per seat per year |
The fastest way to understand MapX is to try it. Open the [Quickstart](/en/quickstart) guide and complete your first spatial analysis in under a minute — no credit card required.
This documentation is built and hosted on [Mintlify](https://mintlify.com), a developer documentation platform.