> ## Documentation Index
> Fetch the complete documentation index at: https://docs.mapxagent.com/llms.txt
> Use this file to discover all available pages before exploring further.
# Quickstart: Upload Data and Build Your First MapX Map
> Learn how to upload a dataset, run your first spatial analysis, and polish or share the result in under a minute using MapX's AI chat interface.
This guide walks you through the complete MapX workflow from a blank screen to a polished, shareable result. By the end you will have created a project, uploaded a dataset, run your first AI-powered spatial query, and styled or shared the result — all in under a minute.
Go to [app.mapxagent.com](https://app.mapxagent.com) and sign up with your email or GitHub account. No credit card is required. You will land on your project dashboard immediately after confirming your email.
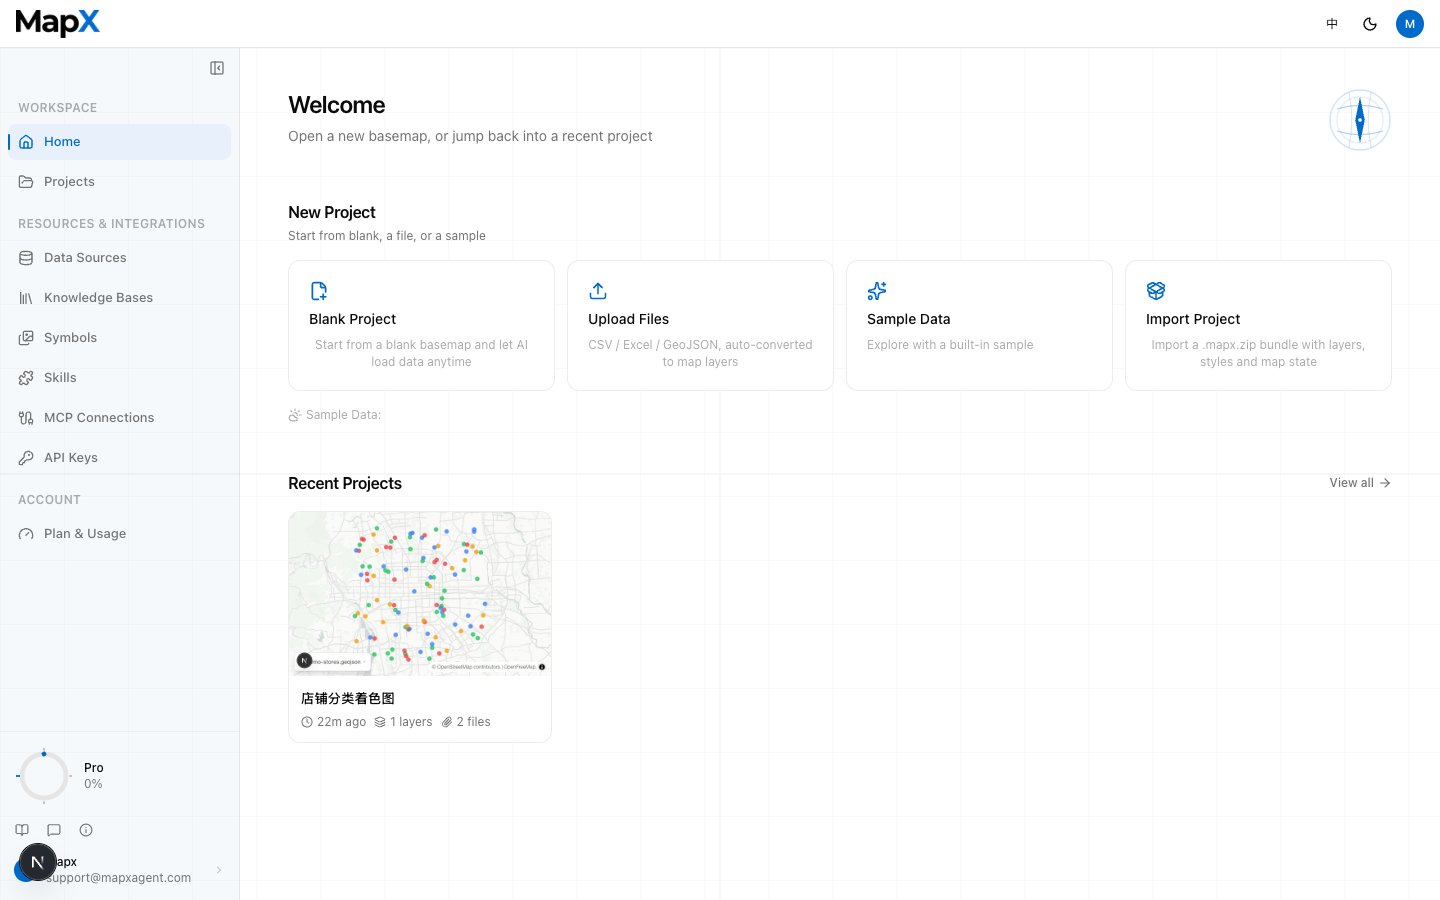
 On the dashboard, open **New Project** and choose how to start:
* **Blank project** — an empty workspace you build up from scratch.
* **Sample data** — explore MapX with a built-in sample dataset.
* **Upload files** — pick local files (CSV, Excel, GeoJSON, Shapefile, GeoTIFF, and more); a project is created and you land in the workspace.
* **Import project** — restore a previously exported project bundle (`.zip` / `.mapx.zip`).
You can add more data or adjust settings later from the project workspace.
On the dashboard, open **New Project** and choose how to start:
* **Blank project** — an empty workspace you build up from scratch.
* **Sample data** — explore MapX with a built-in sample dataset.
* **Upload files** — pick local files (CSV, Excel, GeoJSON, Shapefile, GeoTIFF, and more); a project is created and you land in the workspace.
* **Import project** — restore a previously exported project bundle (`.zip` / `.mapx.zip`).
You can add more data or adjust settings later from the project workspace.
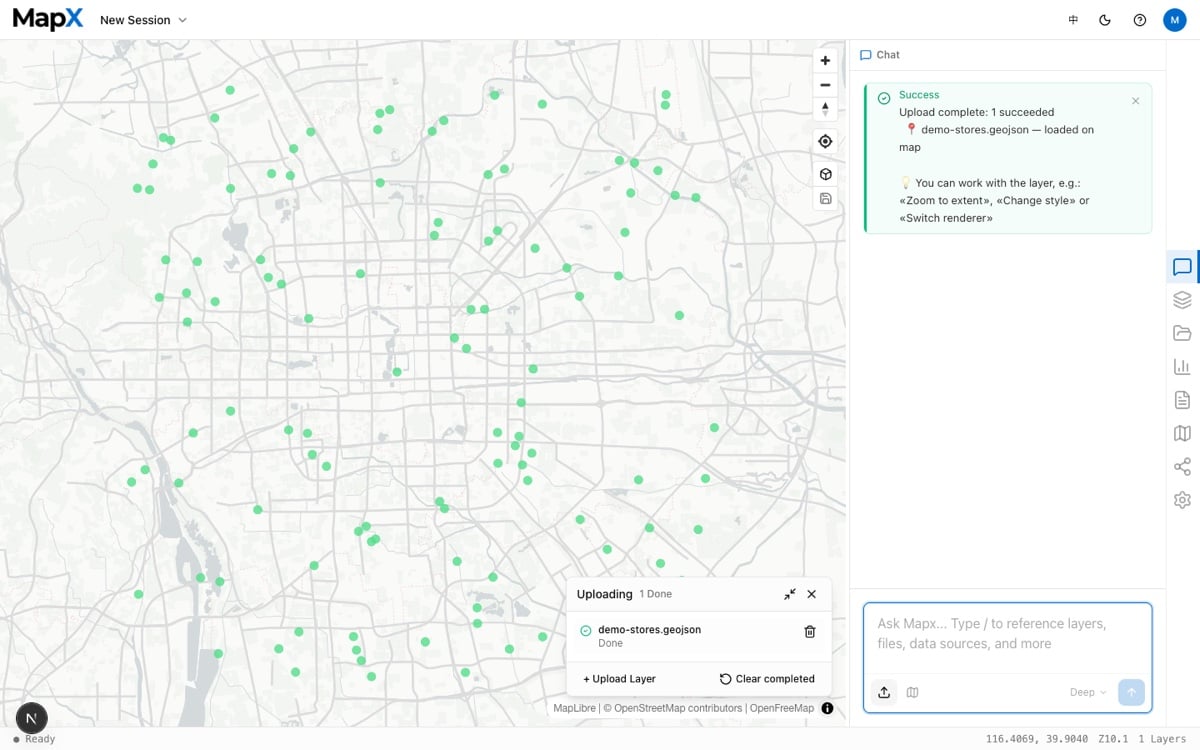
 Drag and drop files onto the upload area, or click **Upload Data** and select them. MapX supports **CSV, Excel, GeoJSON, Shapefile, and GeoTIFF** files, plus text, Word, and PDF documents that the AI can read for analysis.
For table files, MapX scans the column headers, automatically detects latitude/longitude or address columns, and shows a preview so you can confirm the mapping before data is rendered on the map. Uploads run in the background — you can keep working while files convert, and paid plans support single files up to **20 GB**.
Not sure what format to use? See [Uploading Data](/en/uploading-data) for the full list of supported formats and column naming conventions.
Drag and drop files onto the upload area, or click **Upload Data** and select them. MapX supports **CSV, Excel, GeoJSON, Shapefile, and GeoTIFF** files, plus text, Word, and PDF documents that the AI can read for analysis.
For table files, MapX scans the column headers, automatically detects latitude/longitude or address columns, and shows a preview so you can confirm the mapping before data is rendered on the map. Uploads run in the background — you can keep working while files convert, and paid plans support single files up to **20 GB**.
Not sure what format to use? See [Uploading Data](/en/uploading-data) for the full list of supported formats and column naming conventions.
 In the **Chat** panel, type a question in plain English. A simple starting prompt is:
> "Show locations on a map, color points by \[column name]"
MapX interprets your request, applies the right spatial operation, and updates the map in real time. Follow up to refine the result — *"zoom to the top 20 by revenue"* or *"add a 1 km buffer around each point"* — and the AI keeps the whole conversation in context. Type `/` to reference layers, files, data sources, and other assets directly.
Learn how to get the most out of prompts in [AI Chat](/en/concepts/ai-chat), and see the tools behind them in [Analysis](/en/concepts/analysis).
In the **Chat** panel, type a question in plain English. A simple starting prompt is:
> "Show locations on a map, color points by \[column name]"
MapX interprets your request, applies the right spatial operation, and updates the map in real time. Follow up to refine the result — *"zoom to the top 20 by revenue"* or *"add a 1 km buffer around each point"* — and the AI keeps the whole conversation in context. Type `/` to reference layers, files, data sources, and other assets directly.
Learn how to get the most out of prompts in [AI Chat](/en/concepts/ai-chat), and see the tools behind them in [Analysis](/en/concepts/analysis).
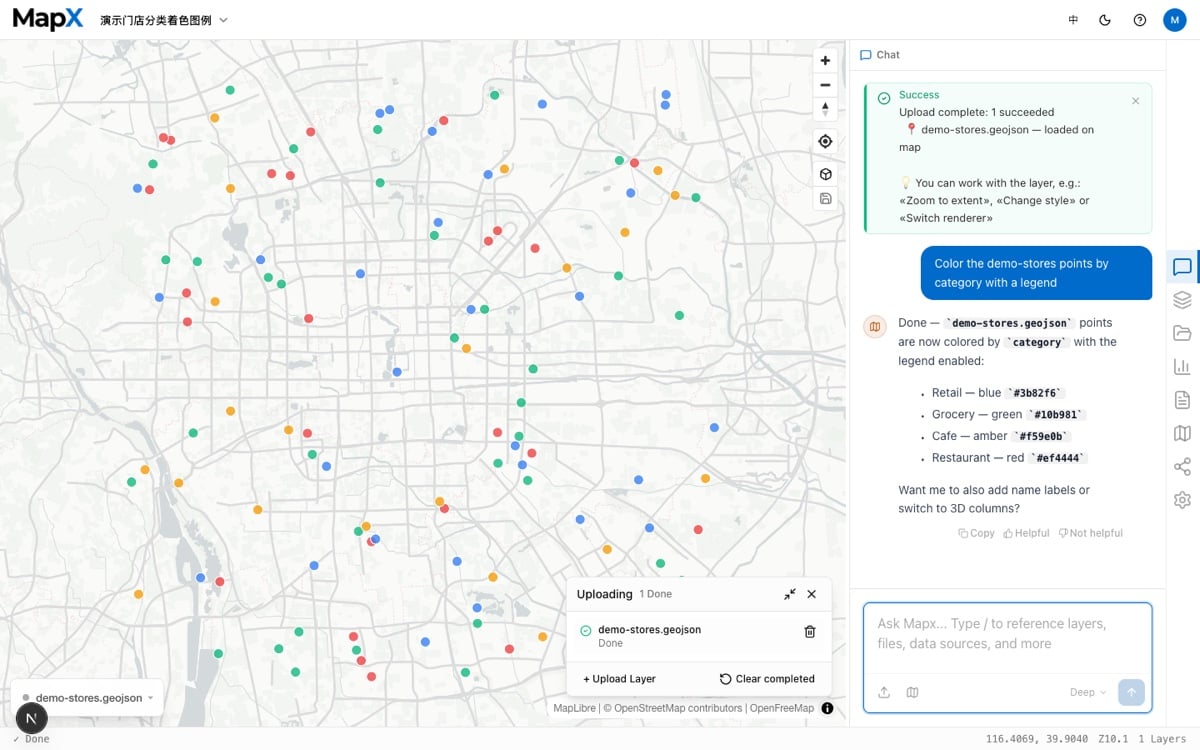 Once you are happy with the map, you can refine the presentation and hand it over:
* **Style layers** — adjust colors, labels, transparency, and renderers through the chat or the [layer style editor](/en/concepts/layers).
* **Switch 2D/3D and save your view** — turn points, lines, and polygons into 3D columns, elevated paths, or extruded surfaces with one click, then save the camera position. See [3D View](/en/concepts/3d-view).
* **Add charts** — ask for a bar, line, or pie chart and pin it to the map as visual evidence. See [Charts](/en/concepts/charts).
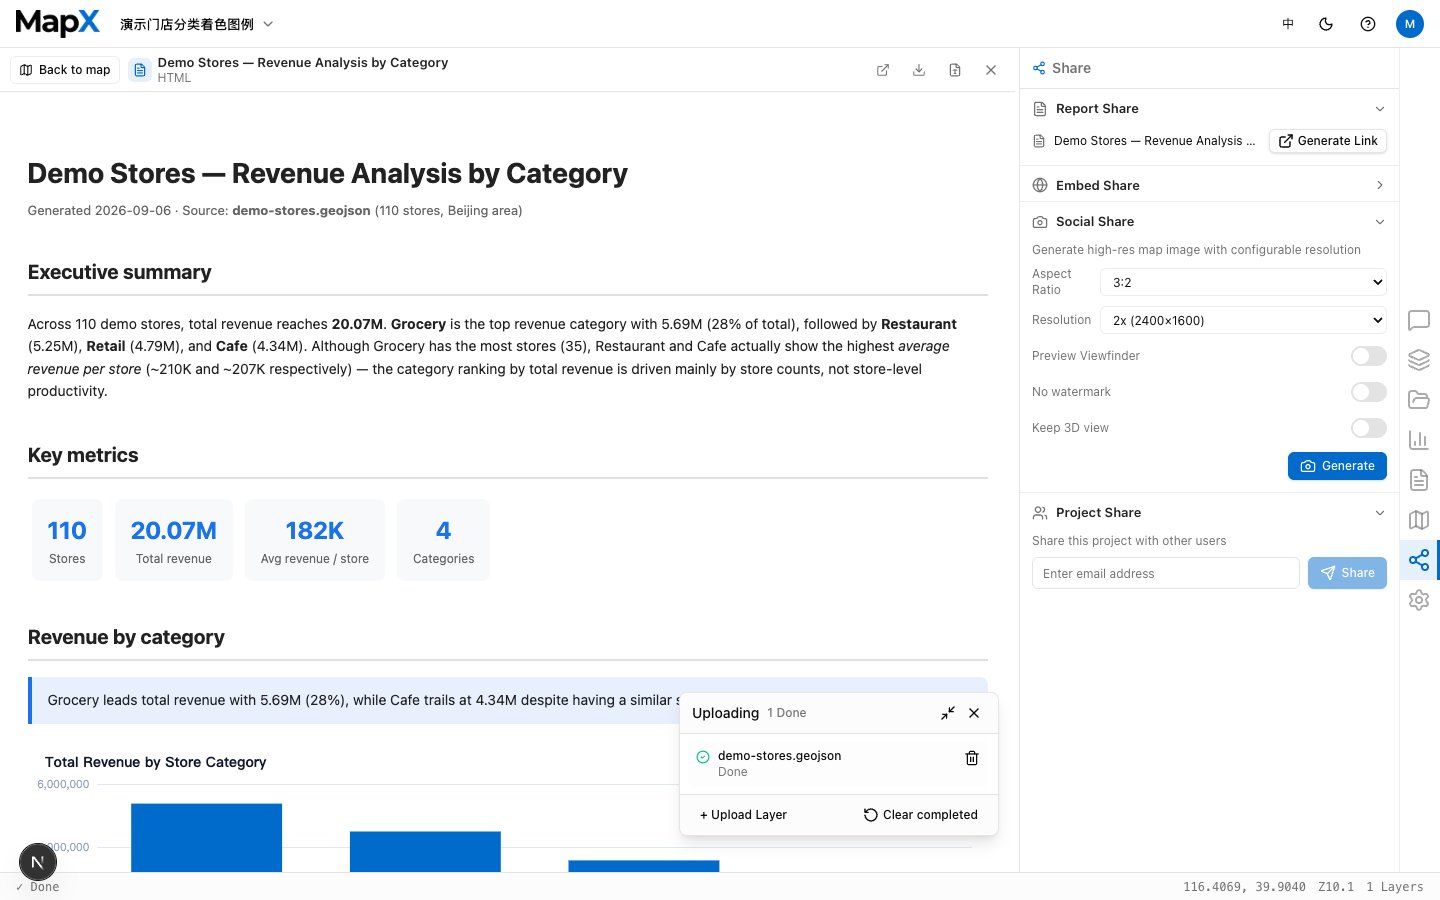
* **Generate a report** — create a self-contained HTML report with interactive maps, charts, and AI-written insights, preview it on a canvas, then download it or share a link. See [Reports](/en/concepts/reports).
* **Share your work** — deliver report links, embed an interactive map on a website, generate a social-ready image, or open access to teammates. See [Sharing](/en/sharing/sharing-maps). You can also export a static PNG from the **Share** panel.
Once you are happy with the map, you can refine the presentation and hand it over:
* **Style layers** — adjust colors, labels, transparency, and renderers through the chat or the [layer style editor](/en/concepts/layers).
* **Switch 2D/3D and save your view** — turn points, lines, and polygons into 3D columns, elevated paths, or extruded surfaces with one click, then save the camera position. See [3D View](/en/concepts/3d-view).
* **Add charts** — ask for a bar, line, or pie chart and pin it to the map as visual evidence. See [Charts](/en/concepts/charts).
* **Generate a report** — create a self-contained HTML report with interactive maps, charts, and AI-written insights, preview it on a canvas, then download it or share a link. See [Reports](/en/concepts/reports).
* **Share your work** — deliver report links, embed an interactive map on a website, generate a social-ready image, or open access to teammates. See [Sharing](/en/sharing/sharing-maps). You can also export a static PNG from the **Share** panel.
 ## Example Prompts by Use Case
```text Retail & Site Selection theme={null}
Show all stores within 500 m of metro stations, color by monthly revenue
Score candidate sites by foot traffic, competitor distance, and median income
Highlight any store location with revenue below $10,000 in red
```
```text Logistics & Delivery theme={null}
Draw 10-minute drive-time zones around each depot
Find all delivery addresses more than 30 minutes from the nearest warehouse
Cluster delivery stops into 5 zones and color each zone differently
```
```text Real Estate theme={null}
Show properties listed above $500,000 within 1 km of a school
Overlay planning boundary polygons on top of the property points
Color parcels by zoning category and show a legend
```
```text Environmental & Infrastructure theme={null}
Show all monitoring stations within 2 km of a river polygon
Heatmap incident reports from the last 12 months
Highlight sites that intersect with flood-risk zones
```
The **Free plan** includes **300 credits per month** and up to **1 project**. If you need more, the Basic plan (\$29/mo) offers 3,000 credits and 30 projects. See [Credits](/en/account/credits) for how billing works and the [pricing page](https://mapxagent.com/#pricing) for a full comparison.
This documentation is built and hosted on [Mintlify](https://mintlify.com), a developer documentation platform.
## Example Prompts by Use Case
```text Retail & Site Selection theme={null}
Show all stores within 500 m of metro stations, color by monthly revenue
Score candidate sites by foot traffic, competitor distance, and median income
Highlight any store location with revenue below $10,000 in red
```
```text Logistics & Delivery theme={null}
Draw 10-minute drive-time zones around each depot
Find all delivery addresses more than 30 minutes from the nearest warehouse
Cluster delivery stops into 5 zones and color each zone differently
```
```text Real Estate theme={null}
Show properties listed above $500,000 within 1 km of a school
Overlay planning boundary polygons on top of the property points
Color parcels by zoning category and show a legend
```
```text Environmental & Infrastructure theme={null}
Show all monitoring stations within 2 km of a river polygon
Heatmap incident reports from the last 12 months
Highlight sites that intersect with flood-risk zones
```
The **Free plan** includes **300 credits per month** and up to **1 project**. If you need more, the Basic plan (\$29/mo) offers 3,000 credits and 30 projects. See [Credits](/en/account/credits) for how billing works and the [pricing page](https://mapxagent.com/#pricing) for a full comparison.
This documentation is built and hosted on [Mintlify](https://mintlify.com), a developer documentation platform.