

The Layers Panel
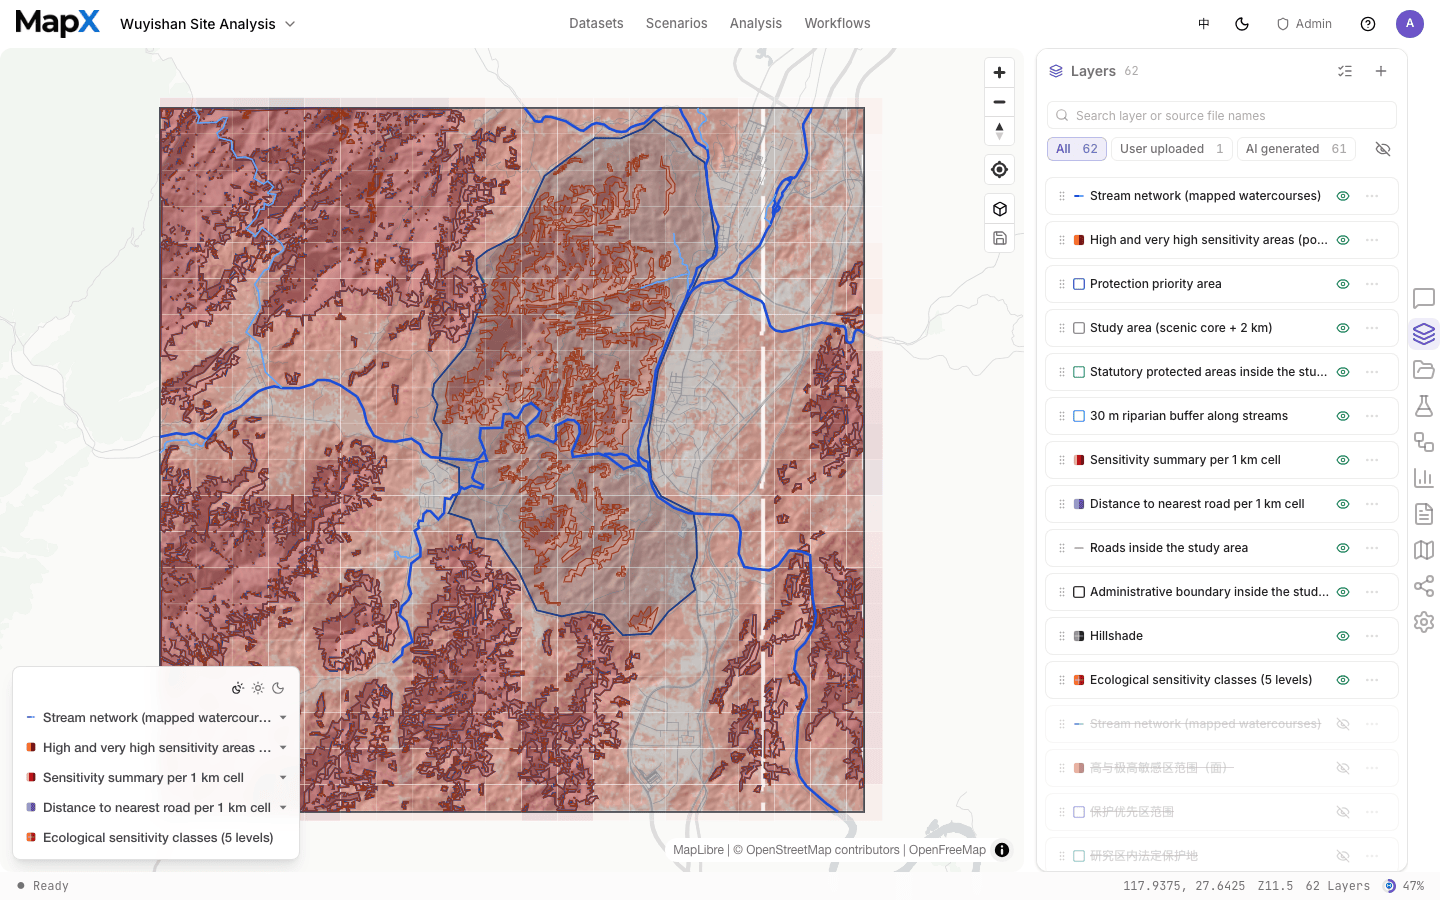
The Layers panel lists every active layer in your project. Each uploaded file (CSV, GeoJSON, Excel, Shapefile), each analysis result (buffer zones, heatmaps, spatial joins, scored sites), and each connected source (online layers, imagery, PostGIS tables) appears as its own entry. Use the toolbar to find and manage layers:- Search — filter layers by name or source file name.
- Source filters — switch between All, User Uploaded, AI Generated, and Online.
- Visible only — hide the list to layers currently shown on the map.
- Toggle visibility — show or hide the layer without deleting it.
- Open the style editor — click a layer to style it (see Styling layers).
- Open the row actions menu (
⋯) — open the attribute table (see Editing data and geometry), zoom to the layer, rename it, download its data (paid plans), delete it, and more.
Batch operations
Enter Select mode to work with several layers at once: select or clear all, show or hide the selected layers, download them together (paid plans), or delete them after confirmation.Styling Layers
Open a layer’s style editor by clicking it in the Layers panel or by asking the AI chat to make a change. Styles applied in the editor and styles applied through chat stay in sync.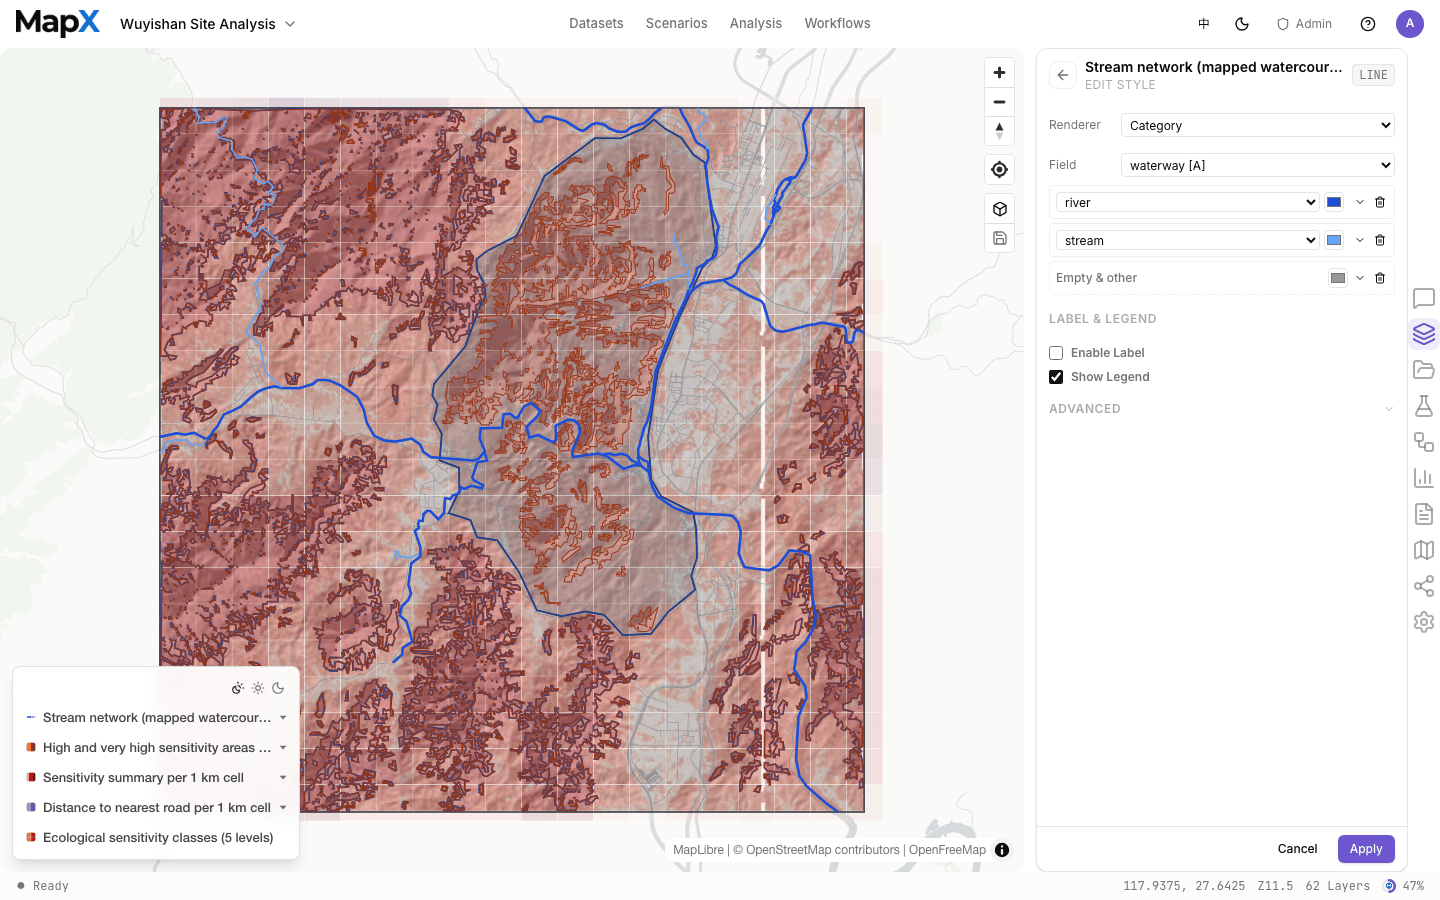
Renderers
Depending on the layer type, the style editor offers renderers such as:- Single color — one flat color for the whole layer.
- Categorized — each unique value in a field (e.g., region or store type) gets its own color and legend entry.
- Graduated and continuous scales — numeric values (revenue, score, density) mapped to color steps or a gradient.
- Heatmap, interpolated, and multi-field renderers — density, surface-like interpolation, and combining several numeric fields into one color.
- Chart and label layers — markers that display charts or attribute labels on the map.
Color, Size, Symbols, and Labels
- Color by field — choose the field and scale for categorical, graduated, or continuous coloring.
- Size by field — scale point radius by a numeric column to add a second visual dimension.
- Symbols — pick symbols from the built-in gallery or upload your own; categorized and graduated renderers can assign a different symbol to each class or range.
- Labels — show text labels for points, lines, polygons, and charts, with configurable fields and styling.
- Opacity — adjust layer transparency (0–100%) so underlying layers stay readable.
- Legend — toggle the on-map legend for your layer.
Example prompt
Example prompt
3D Styles
The style editor includes a 3D section for layers rendered in 3D view — for example column height for point layers, elevation for paths, and extrusion for polygons. See 3D View for how 2D and 3D styles relate.Editing data and geometry
MapX lets you edit a layer’s data and geometry without leaving the browser. Open the attribute table from a layer in the Layers panel, inspect the rows, and make changes that are written back to the layer’s source. Editing works for layers you uploaded as GeoJSON files and for PostGIS database layers alike. Changes save immediately: each edit you finish is committed on the spot — there is no separate “start editing” session to begin or end.Open the attribute table
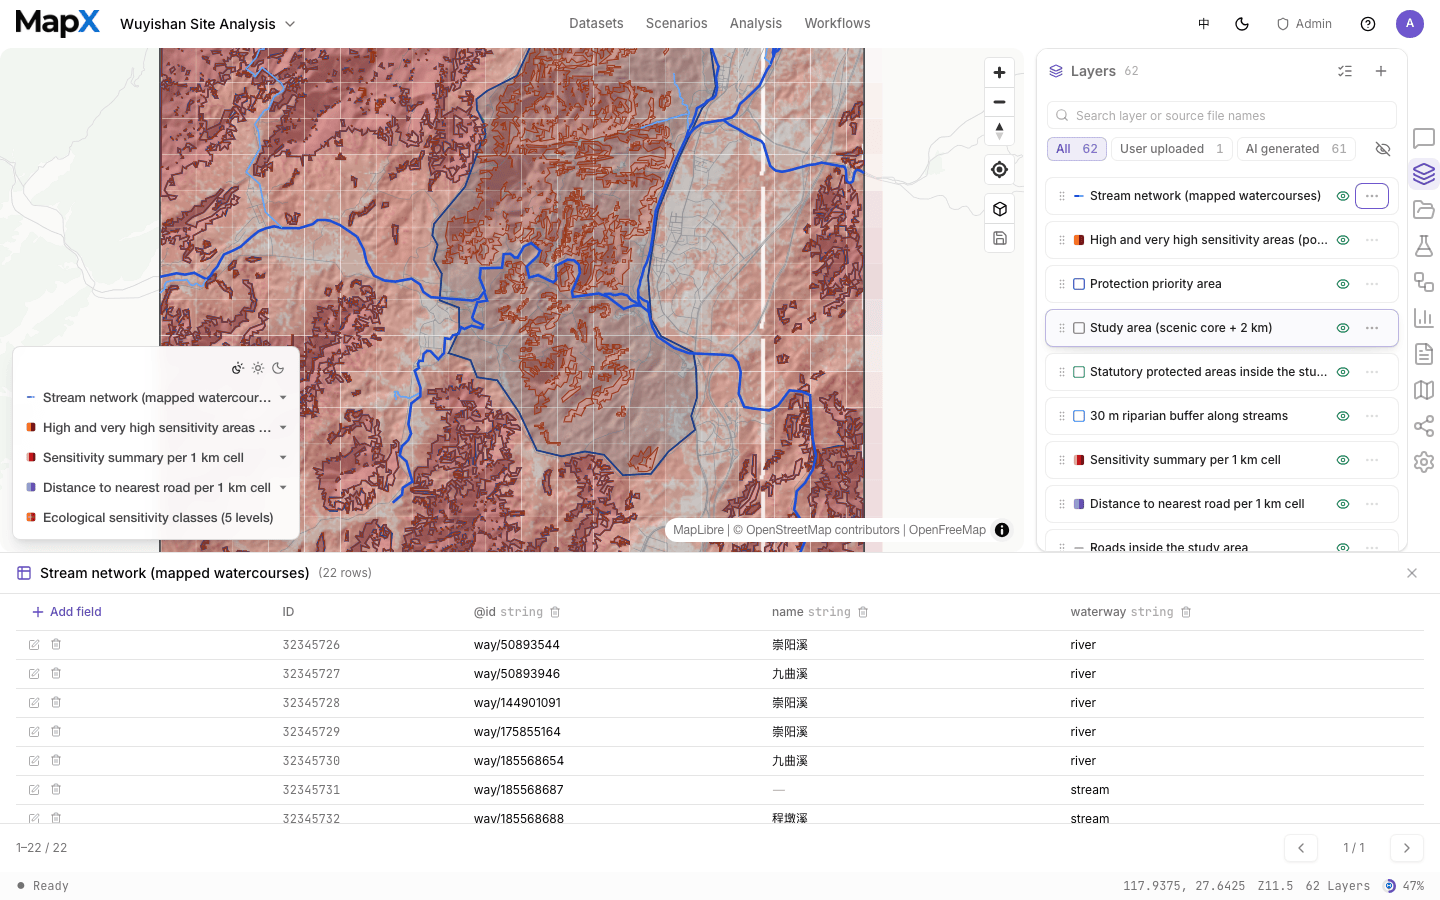
In the Layers panel, open the layer’s row actions menu (⋯) and choose Attribute table. The table opens at the bottom of the workspace, showing one row per feature. Click a row to highlight the corresponding feature on the map; click it again to clear the highlight.
Edit attributes
- Edit a row — click the Edit feature button on a row to enter its edit state. Only values you actually change are written back when you finish.
- Edit a cell — click a value, change it, then press Enter or click away. The change is saved immediately. Numbers and booleans are validated against the column type.
- Add a field — use the add-field control in the table header; choose a name, type (string, number, or boolean), and an optional default value.
- Delete a field — remove a column you no longer need. Fields that are used by the layer’s style or labels cannot be deleted until you remove that use.
- Delete a row — click the row’s delete button and confirm. The feature is removed from the layer.
Edit geometry
Click the pencil button on a row to enter geometry editing. MapX shows the feature’s vertices on the map:- Move a vertex — drag it to a new position; the shape previews live as you drag.
- Add a vertex — click a midpoint handle on a line or polygon edge.
- Delete a vertex — double-click a vertex (lines keep at least 2 points, polygon rings keep at least 3).
- Move a point feature — drag the point marker to its new location.
Editing with others
If someone else changes the same feature while you are editing it, MapX keeps the latest version and asks you to apply your change again — your edit is not silently lost.Editing limits
Layers with up to 10,000 features and 20 MB are fully editable. Larger layers open in read-only preview mode (up to 100,000 features and 200 MB) so you can still browse rows and highlight features, but not modify them.Every edit is saved as soon as you finish it, and there is no undo stack.
Review your changes before confirming a delete.
Multi-Layer Analysis
One of MapX’s most powerful capabilities is combining multiple layers in a single view. A typical multi-layer map might include:- A demographic heatmap as the bottom-most layer (continuous color, semi-transparent)
- Competitor locations as a point layer (red, medium opacity)
- Your store locations as a point layer (blue, full opacity, sized by revenue)
- Buffer zones around your stores as a polygon layer (blue outline, low fill opacity)