

1
Create your free account
Go to app.mapxagent.com and sign up with your email or GitHub account. No credit card is required. You will land on your project dashboard immediately after confirming your email.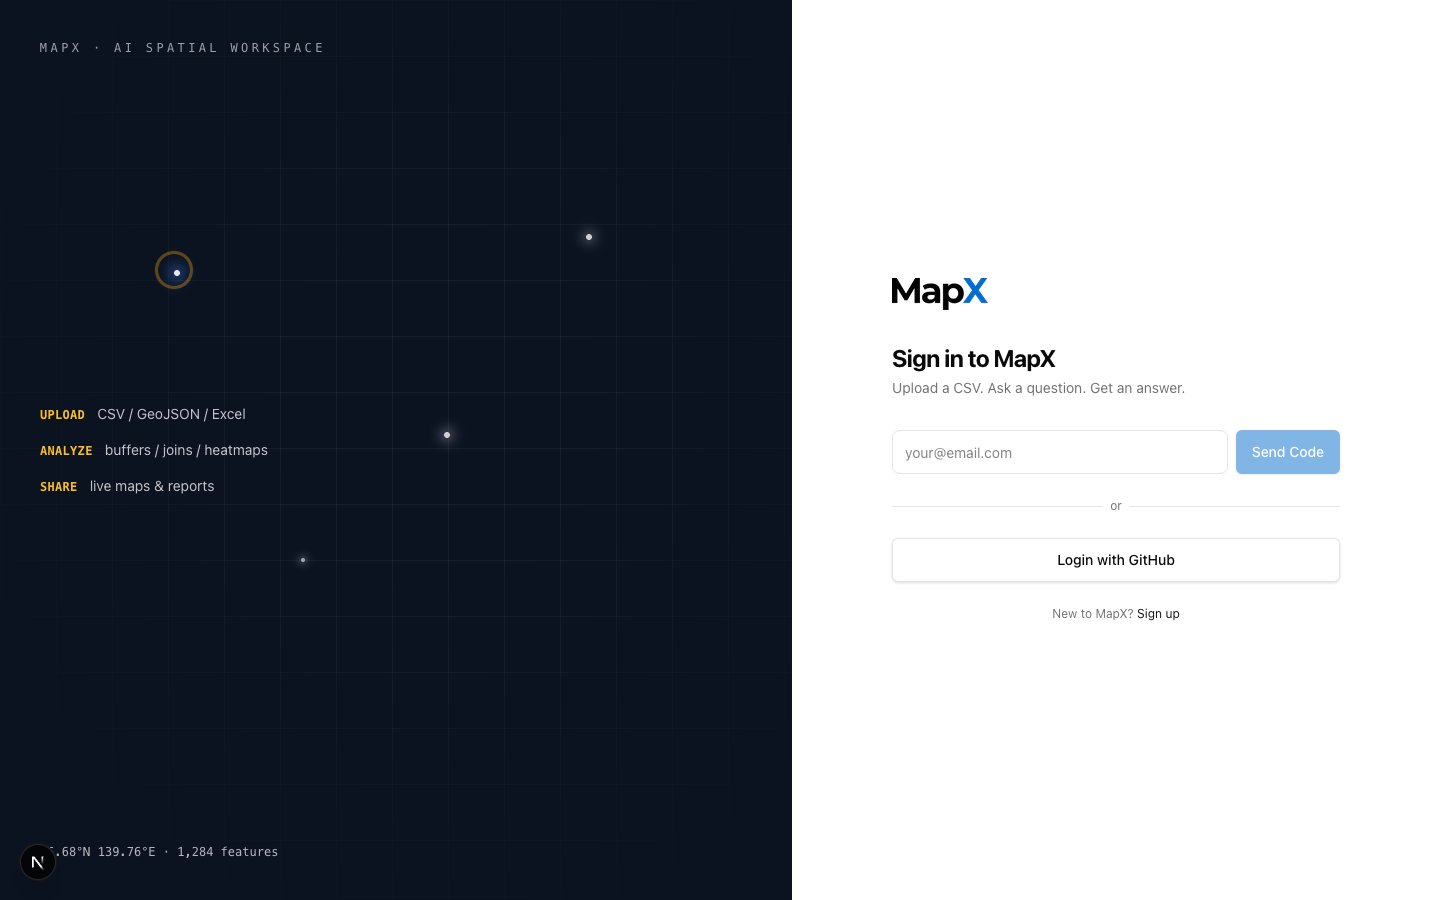
2
Create a new project
On the dashboard, open New Project and choose how to start: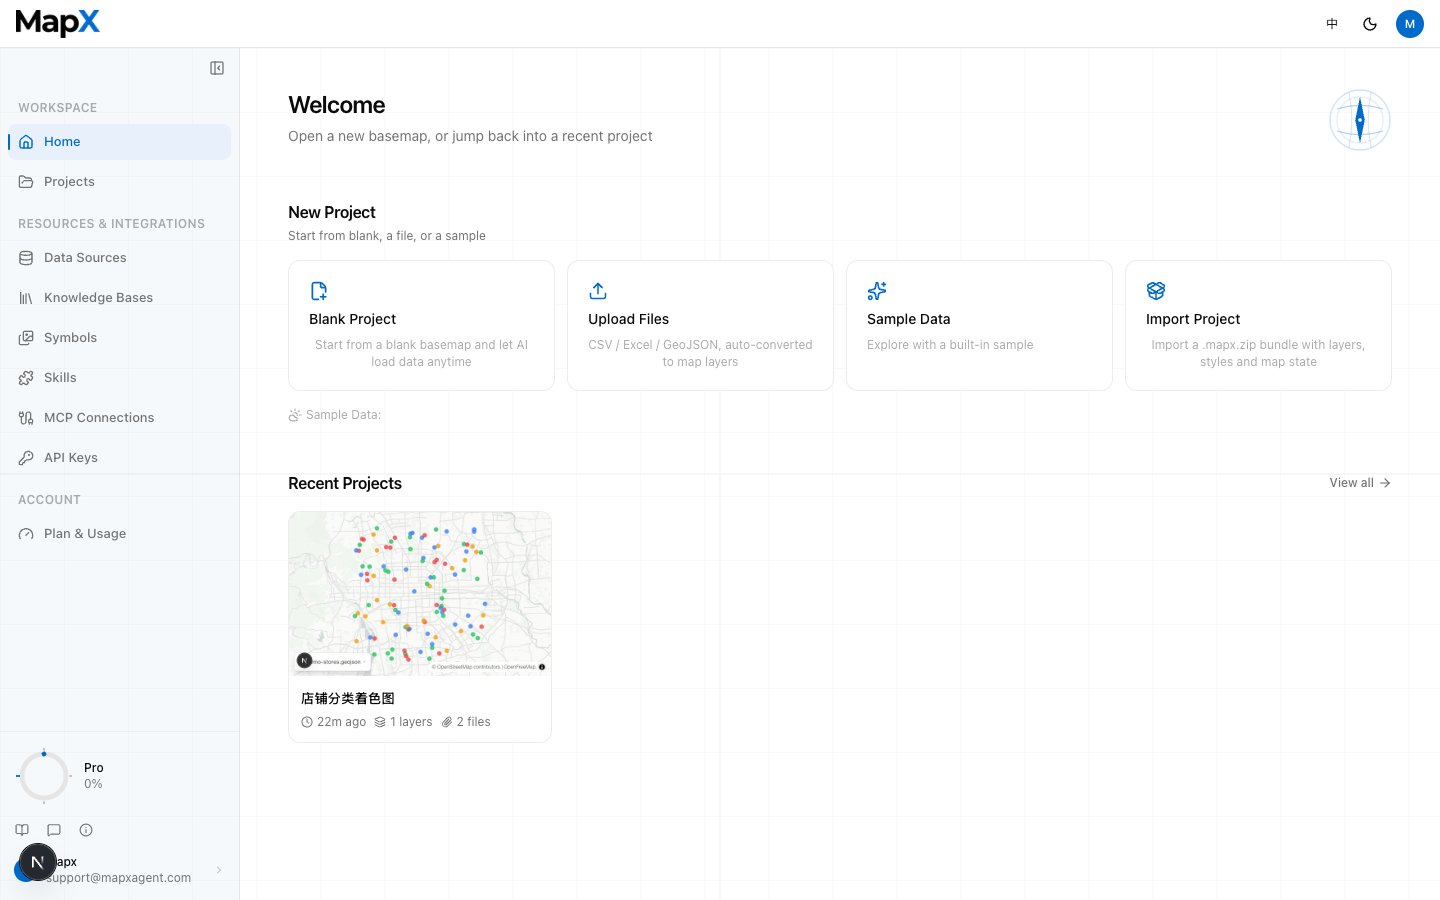
- Blank project — an empty workspace you build up from scratch.
- Sample data — explore MapX with a built-in sample dataset.
- Upload files — pick local files (CSV, Excel, GeoJSON, Shapefile, GeoTIFF, and more); a project is created and you land in the workspace.
- Import project — restore a previously exported project bundle (
.zip/.mapx.zip).
3
Upload your data
Drag and drop files onto the upload area, or click Upload Data and select them. MapX supports CSV, Excel, GeoJSON, Shapefile, and GeoTIFF files, plus text, Word, and PDF documents that the AI can read for analysis.For table files, MapX scans the column headers, automatically detects latitude/longitude or address columns, and shows a preview so you can confirm the mapping before data is rendered on the map. Uploads run in the background — you can keep working while files convert, and paid plans support single files up to 20 GB.Not sure what format to use? See Uploading Data for the full list of supported formats and column naming conventions.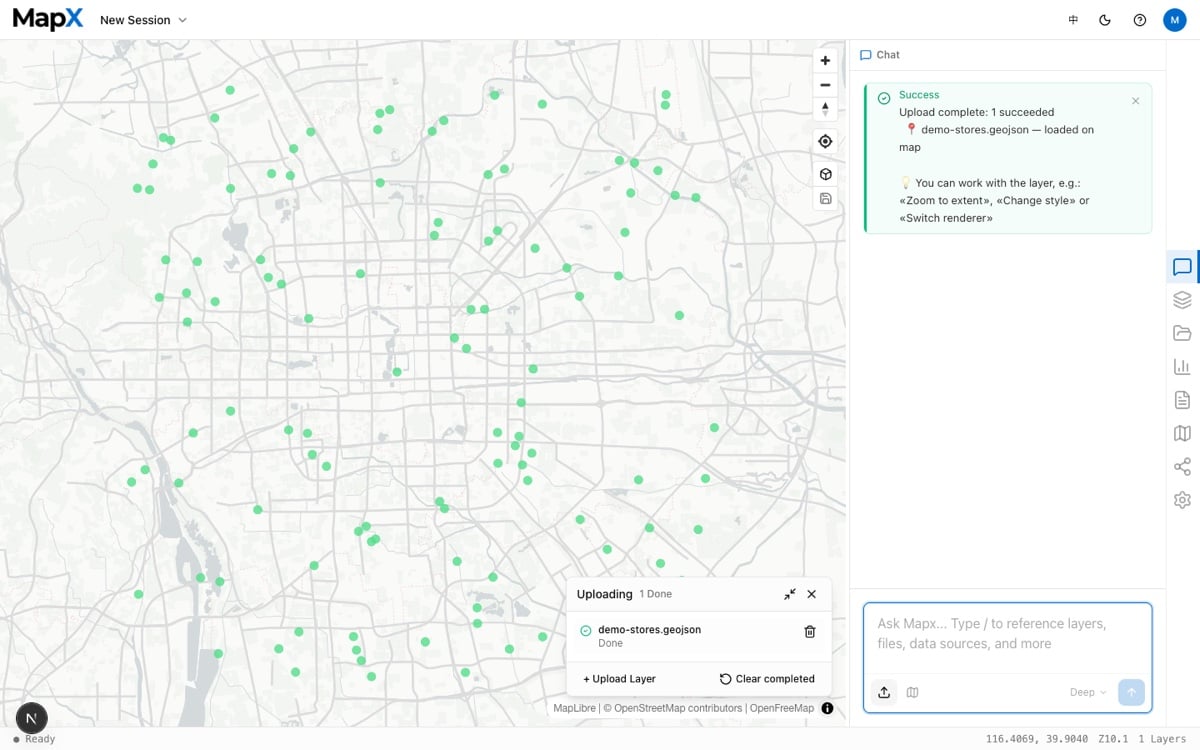
4
Ask your first question
In the Chat panel, type a question in plain English. A simple starting prompt is: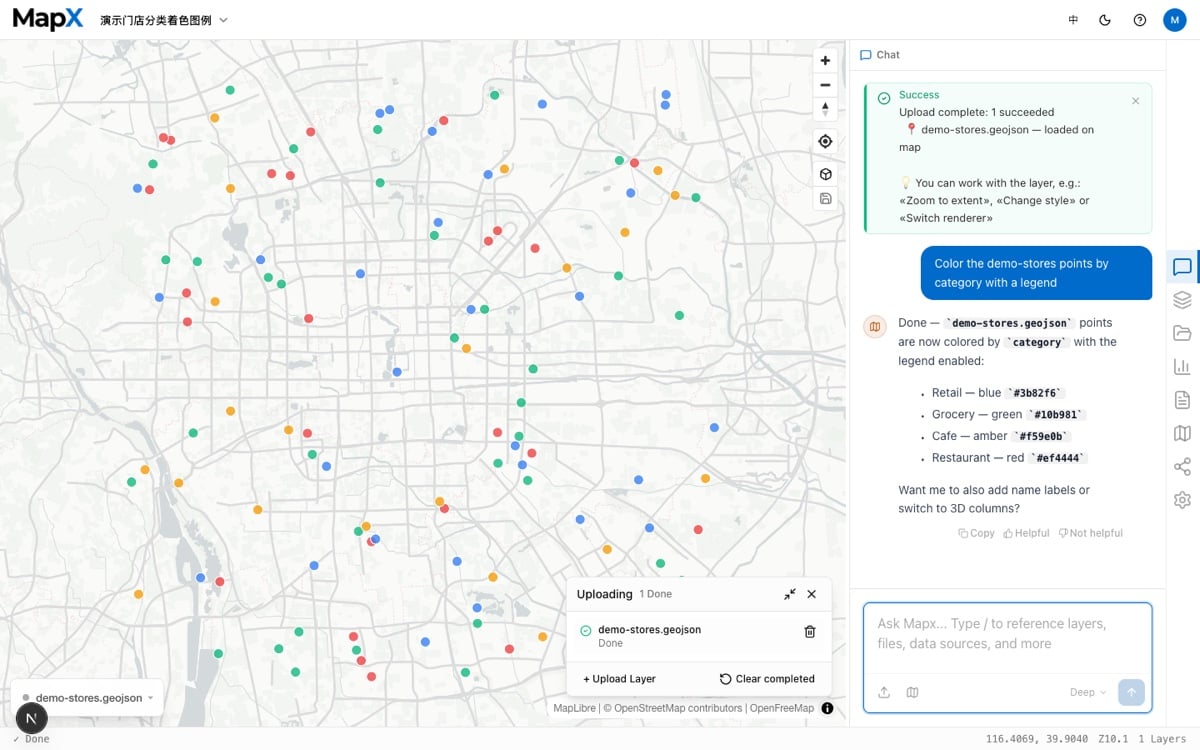
“Show locations on a map, color points by [column name]”MapX interprets your request, applies the right spatial operation, and updates the map in real time. Follow up to refine the result — “zoom to the top 20 by revenue” or “add a 1 km buffer around each point” — and the AI keeps the whole conversation in context. Type
/ to reference layers, files, data sources, and other assets directly.Learn how to get the most out of prompts in AI Chat, and see the tools behind them in Analysis.5
Polish and deliver the result
Once you are happy with the map, you can refine the presentation and hand it over:
- Style layers — adjust colors, labels, transparency, and renderers through the chat or the layer style editor.
- Switch 2D/3D and save your view — turn points, lines, and polygons into 3D columns, elevated paths, or extruded surfaces with one click, then save the camera position. See 3D View.
- Add charts — ask for a bar, line, or pie chart and pin it to the map as visual evidence. See Charts.
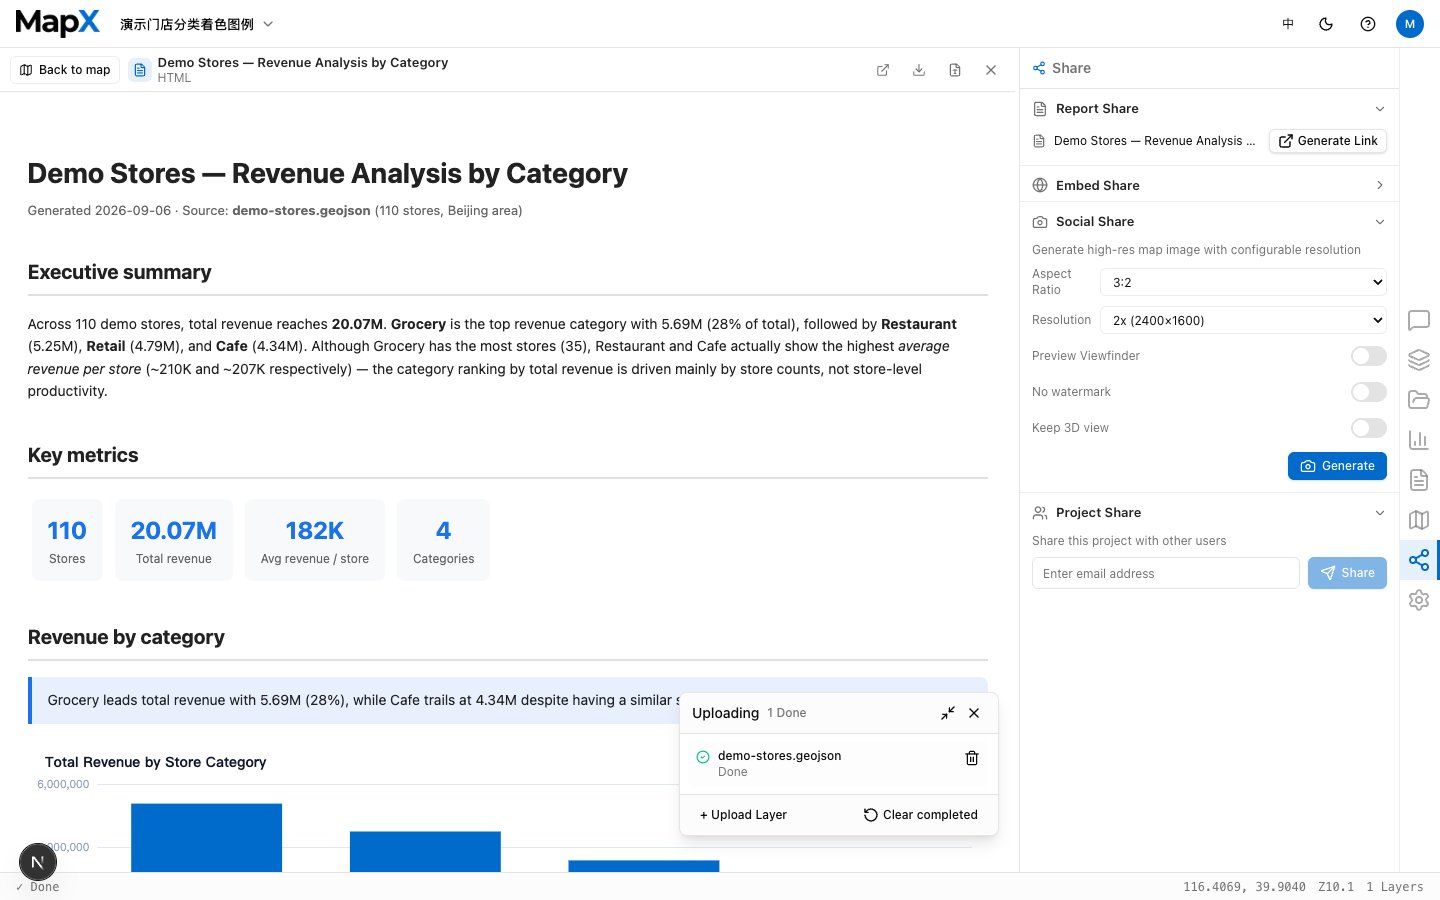
- Generate a report — create a self-contained HTML report with interactive maps, charts, and AI-written insights, preview it on a canvas, then download it or share a link. See Reports.
-
Share your work — deliver report links, embed an interactive map on a website, generate a social-ready image, or open access to teammates. See Sharing. You can also export a static PNG from the Share panel.
Example Prompts by Use Case
The Free plan includes 300 credits per month and up to 1 project. If you need more, the Basic plan ($29/mo) offers 3,000 credits and 30 projects. See Credits for how billing works and the pricing page for a full comparison.