

- A plan belongs to one project. The AI researches the question, writes a plan document, and waits for your approval before anything runs.
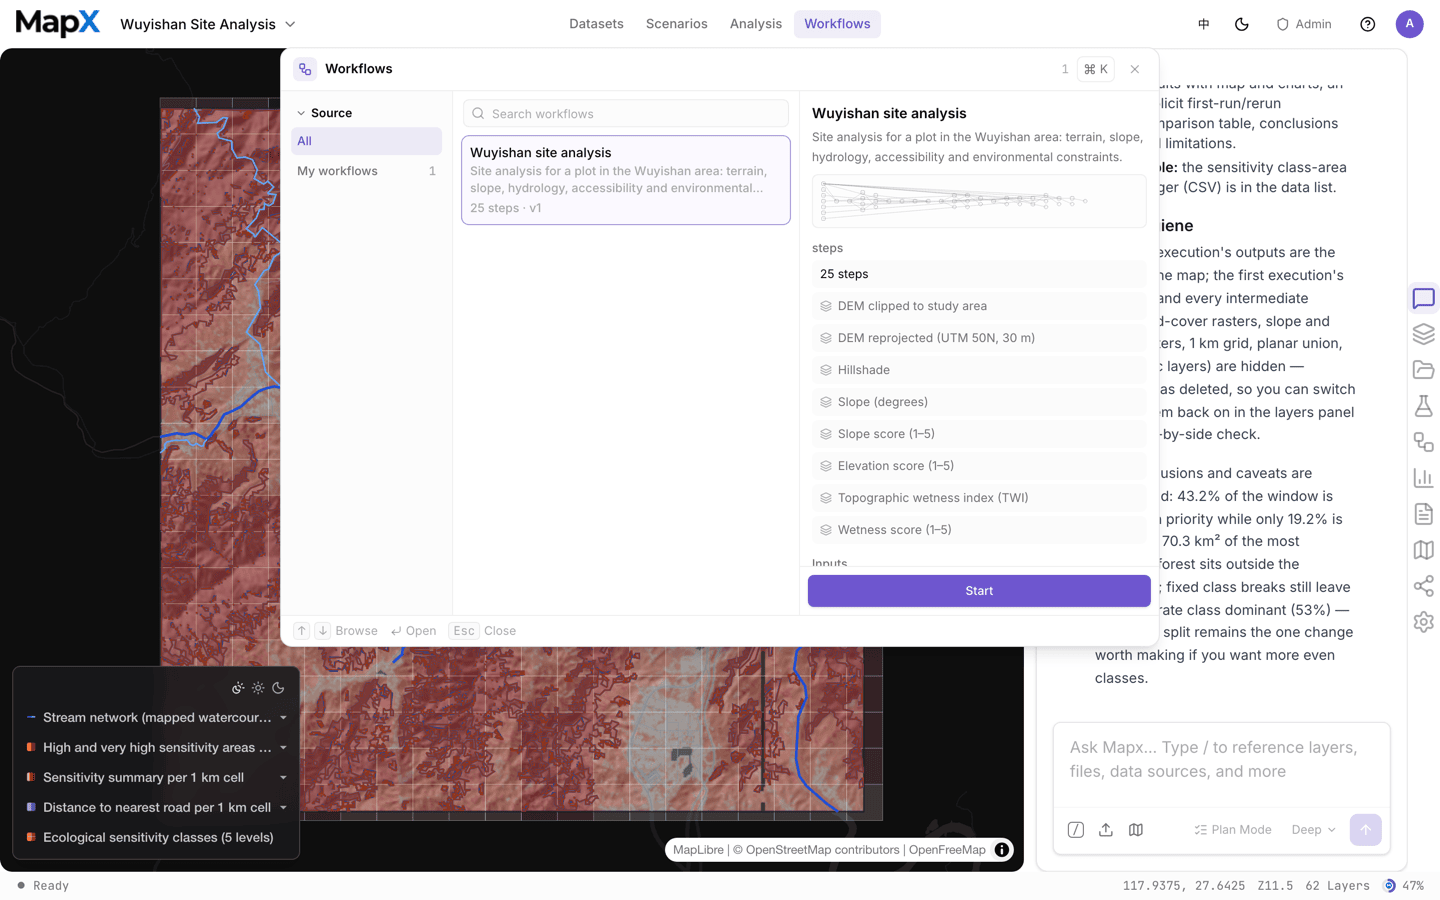
- A workflow is a published plan turned into a reusable asset: the same steps, with typed input slots instead of hard-coded layers, runnable on other data and shareable with your team.
Plan first, then run
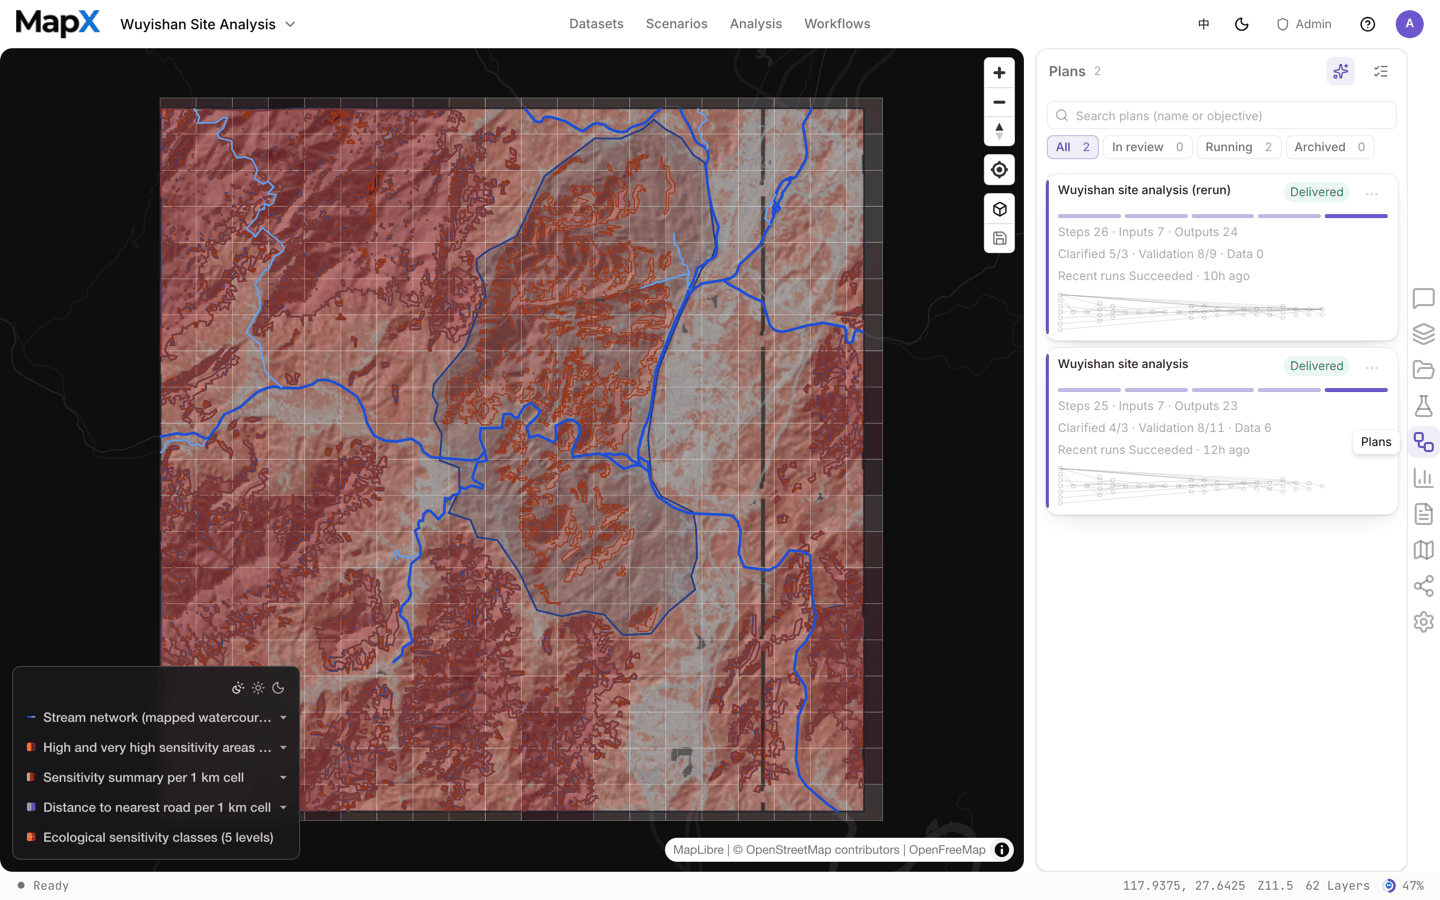
Planning is on by default in the chat input: the AI researches read-only, writes a plan document for you to review, and executes only after you approve. Approval happens on the decision card in the chat — the same card that lets you send a revision or abandon the plan, and it stays in the conversation afterwards as a record. The full lifecycle — clarifying questions, the read-only research phase, the seven-chapter document, the decision card and the plan statuses — has its own page: Plan mode. Each executed step is a tool run from the analysis catalog, so results are real layers, tables and charts. A plan is tied to the project it was written for, and it is not re-runnable as-is: to repeat the work on other data, fork it into a new plan or publish it as a workflow.Publish a workflow
Publishing turns an approved plan into a reusable asset:- Input slots replace the layers the plan was written against. The workflow declares what it needs — for example a point layer of candidates and a polygon layer of zones.
- Steps stay fixed, so the method is reproducible; only the data changes.
- Team sharing is optional: share the workflow so team members can run it, while only you can edit it.
Run a published workflow
1
Open the catalog
Top menu → Workflows lists your saved workflows with their tags, input slots, and step counts. The dashboard has the same library outside a project.
2
Bind the inputs
For each input slot, pick a layer from the current project. Slots are typed, so a slot that expects polygons only offers polygon layers.
3
Run
Choose Run. The execution opens as a graph of the steps, with a live state and a running counter for each. See The workflow graph below for how to read and steer it.
4
Read the results
Finished steps publish their layers, tables, and reports into the project, where you can open, style, and share them like any other result.
The workflow graph
A run opens as a directed graph rather than a list: one node per step, and an edge wherever a step consumes another step’s output. Edges are labelled with what travels along them, so you can see which steps feed which, and where one result branches into several downstream steps. Solid edges carry data; dashed edges are execution-order dependencies or an input slot waiting for data. Every node shows the step’s intent and the operator that runs it — Raster Calculator, Euclidean Distance, Clip, Buffer Analysis, and so on — so the same picture doubles as documentation of the method.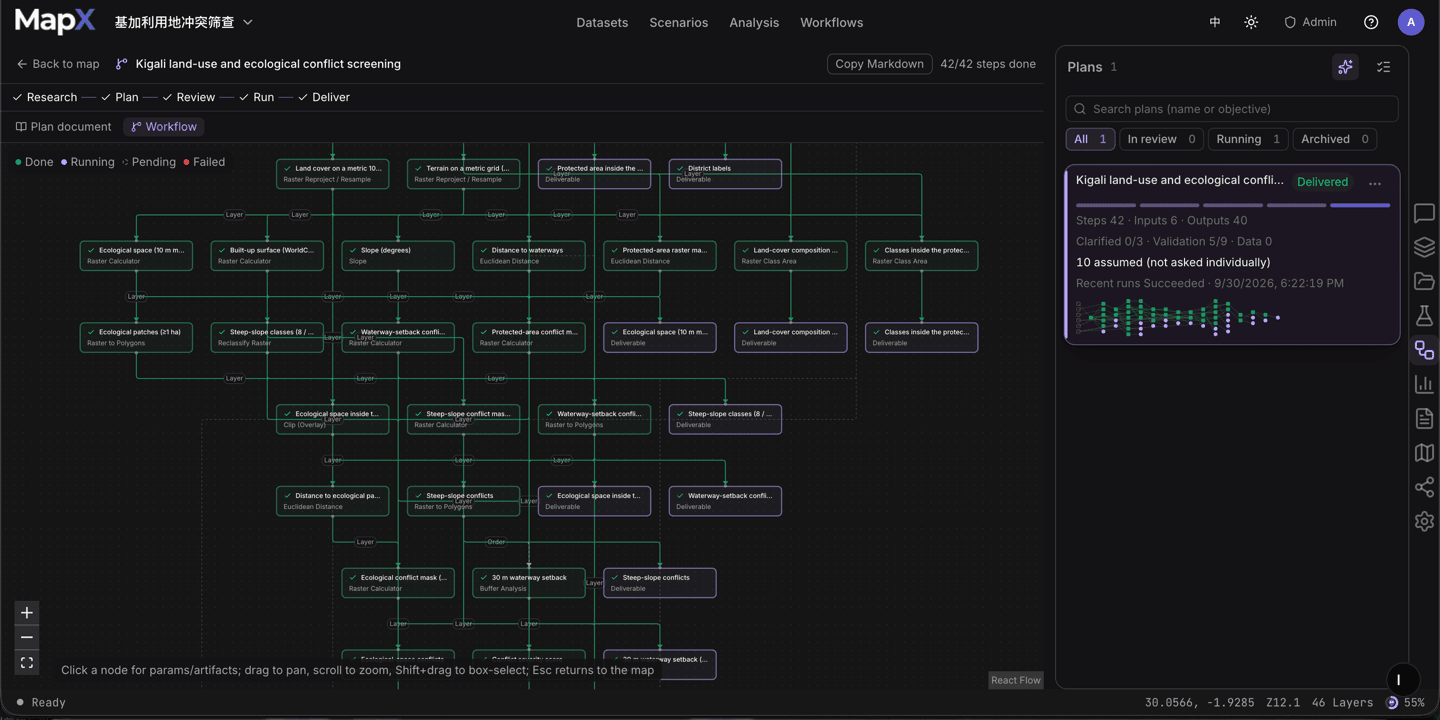
- Done — the step finished and published its output.
- Running — the step the engine is working on right now; edges out of it animate as results land.
- Pending — not reached yet. Steps that were deliberately skipped are marked Skipped.
- Failed — the step stopped with an error.
Reading and steering a run
- Click a node to open the inspector: intent, operator, parameters, inputs, and artifacts, plus status, duration, credits, and iteration count — or the error and a Retry step button when it failed.
- Human gate nodes wait for you. The inspector shows the question, an answer box, and Cancel run.
- A node with no data bound yet shows Awaiting data and offers a shortcut to pick a layer from the current project or from the built-in catalog.
- Pan and zoom — drag to pan, scroll to zoom, Shift+drag to box-select several nodes; Esc returns you to the map.
- Switch between Plan document and Workflow to read the plan text you approved and the graph of the same steps.
Where runs live
When a step fails
A workflow run reports the failing step and offers to retry that step; steps that already succeeded are not recomputed. Opening the step’s run detail shows the same reason and next step the analysis ledger shows — for example an input budget that was exceeded, a missing field, or data the tool cannot use. Some workflows pause on a human confirmation step: the run waits for your answer before continuing. This is how a workflow keeps a judgement call — accepting an unbound input, approving a threshold — visible instead of burying it in code.Deterministic steps (the analysis tools) do not consume AI credits; AI decision steps and the planning conversation do. See Credits.