

Plan availability
Downloading data requires Basic or higher. On Free you can analyse and visualise data in the project, but not download it. The row shows Upgrade to download in place of the download action.
A map image
The high-resolution PNG comes from the Share panel, where you also choose the aspect ratio, resolution, watermark, 3D perspective, pinned chart, and legend placement. It downloads straight to your browser and is never uploaded anywhere. See Sharing for the full walkthrough.Layer data
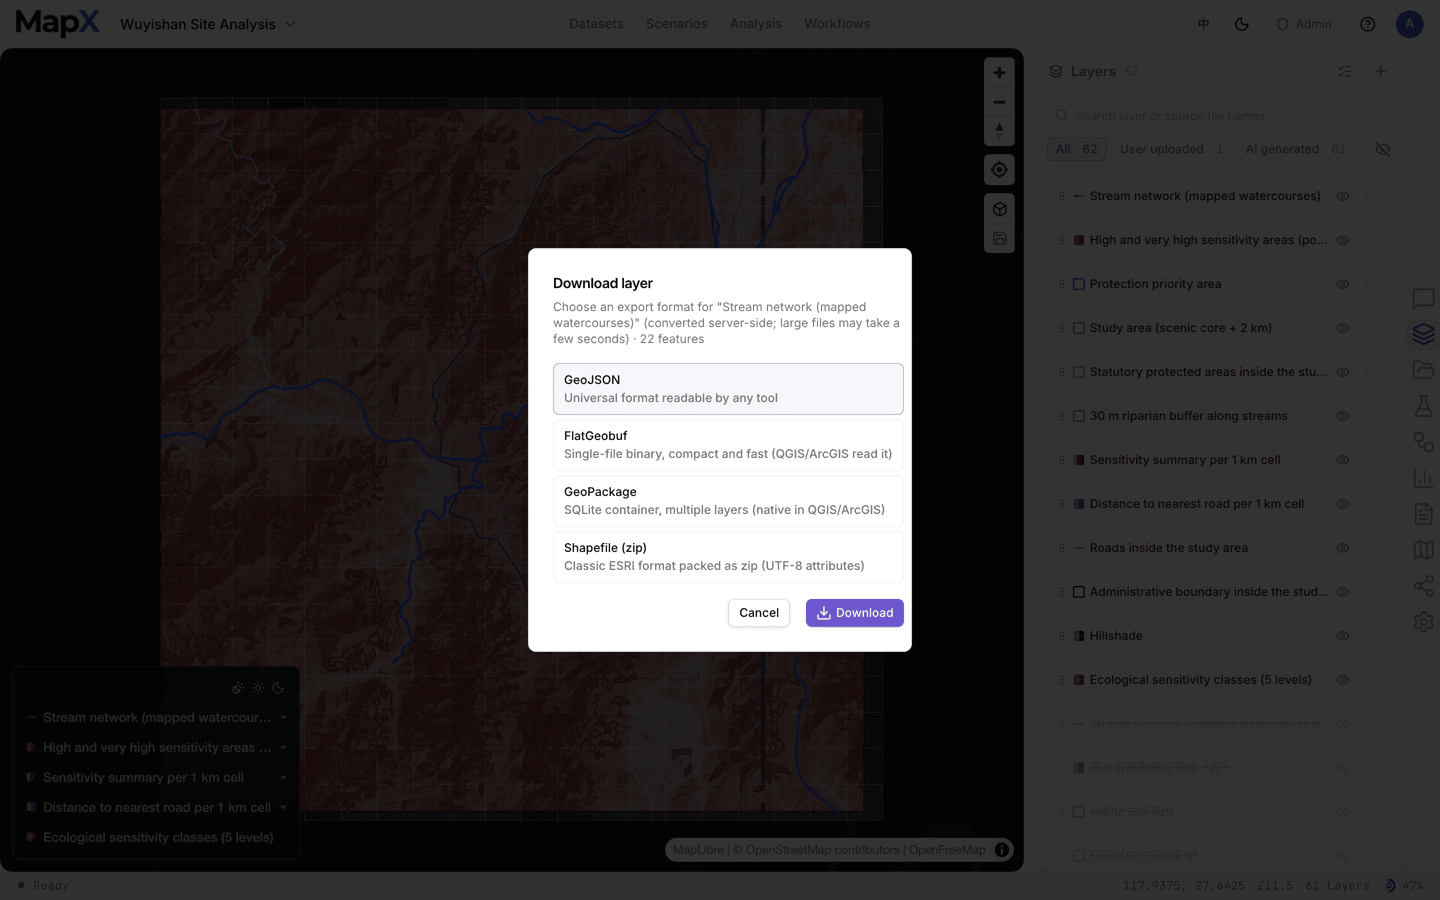
Every vector layer can be exported on its own, in the format your downstream tool wants. Open the layer row’s ⋯ menu and choose Download:
Only the formats your deployment’s GDAL build supports appear in the dialog; GeoJSON is always available. Raster layers export as images, not as vector formats.
Exported geometry keeps the coordinates the layer was stored with. If a layer has no declared coordinate system, the dialog says so — “Not declared (assumed WGS 84 from lon/lat range)” — and treats longitude/latitude values as WGS 84.
Several layers at once
Turn on batch select in the Layers panel, tick the layers you want, and choose Download. MapX packages the selection into a single zip instead of asking you to download layer by layer.Source files
Your uploaded files are untouched by analysis, so the Data panel keeps the original. Each row has a Download action that returns the file exactly as you uploaded it — useful when you need the original CSV, spreadsheet, or document rather than the derived layer.Charts
Charts export from the Charts panel in three formats:
Exporting a chart uses the chart’s own background and colours, including transparency. See Charts for building and pinning charts.
Reports
Reports are files in the project, and the Reports panel is the export surface. Each row offers:- Preview report — opens the report in a new tab.
- Export PDF — renders the report to PDF on the server, then downloads it.
- Download report — downloads the file in the format it was generated in: HTML, Word, or PowerPoint.
Project manifest
A manifest packages the project’s map state and layer configuration — basemap, layer styles, labels, legends, and visibility — into<project-title>-manifest.zip. It describes how the project looks and is arranged; it is not a data backup.
1
Open the Settings panel
In the workspace rail, open Settings (the gear icon).
2
Choose Export manifest
The section is enabled on Basic and above; on Free it points at the upgrade page instead.
3
Save the zip
The browser downloads
<project-title>-manifest.zip, which contains the manifest describing the layers and their styling.